The following comes from the Urban Institute’s National Center for Charitable Statistics, or NCCS. We are pleased to share publication of this piece with them. Please visit their website for more information like this!
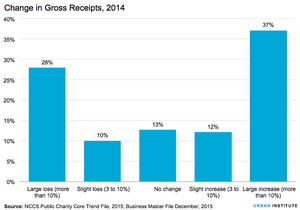
Analysis of changes in gross receipts for organizations filing a Form 990 or 990-EZ in 2013 and 2014 shows an increasingly healthy nonprofit sector. In 2014, 37 percent of public charities saw an increase in gross receipts of more than 10 percent from the previous year—the highest share since the Great Recession. On the opposite end of the spectrum, 28 percent of public charities saw more than a 10 percent drop in gross receipts during 2014—the lowest share since its peak in 2009 when 35 percent of public charities fell into this category.
A closer look at Forms 990 and 990-EZ by sector reveals which types of nonprofits were the biggest winners and losers in 2014.
 The subsectors with the biggest share of winners also had the biggest share of losers
Environment and animal charities and international and foreign affairs charities had the largest percentages of “big winners” in 2014. Forty-three percent of environment and animal charities saw an increase greater than 10 percent in gross receipts during 2014. Similarly, 42 percent of international and foreign affairs organizations saw a similar increase in gross receipts. But these types of organizations also had the largest percentage of organizations with big losses, indicative of the revenue volatility within each. Thirty-five percent of international and foreign affairs and 32 percent of environment and animal organizations saw a loss of more than 10 percent in 2014.
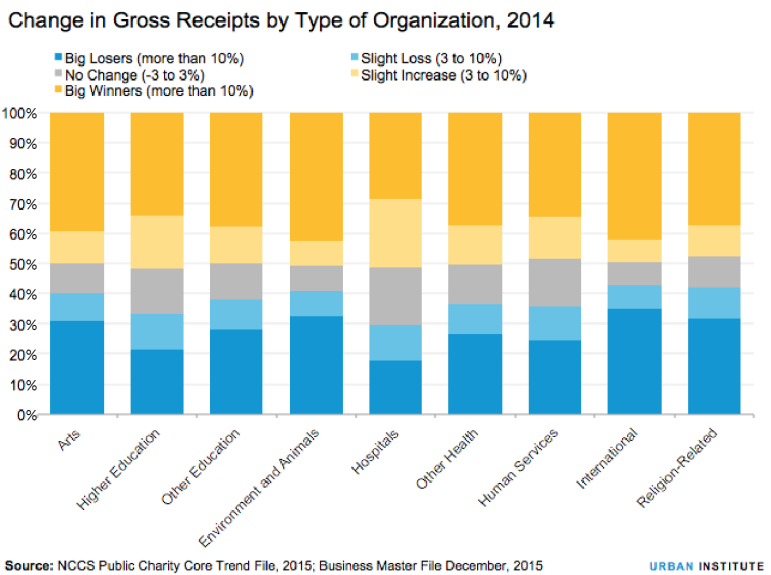
Nonprofit hospitals and higher education institutions have the fewest “big winners”
Sign up for our free newsletters
Subscribe to NPQ's newsletters to have our top stories delivered directly to your inbox.
By signing up, you agree to our privacy policy and terms of use, and to receive messages from NPQ and our partners.
In 2014, 29 percent of hospitals and 34 percent of higher education public charities showed a gain in gross receipts of more than 10 percent—the two lowest percentages of big winners. These organizations were much more likely than other types of charities to have gross receipts remain stable or to see only a slight increase (3 to 10 percent) in gross receipts since 2013. As many hospitals and higher education charities are large organizations, the lack of big gains could be more related to the size of the organization rather than the type. Smaller public charities tend to show larger fluctuations (growth and decline) when looking at year-to-year growth rates than larger organizations.
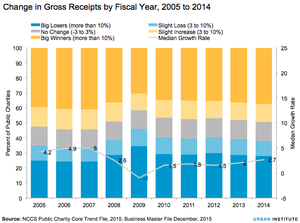
Public charity growth is strong, but still not as strong as it used to be
Before the Great Recession, 41 percent of public charities reported gains in gross receipts of more than 10 percent. Though the percentage of public charity “big winners” has been steadily increasing since 2010, public charity growth is still not back up to pre-recession levels. A look at the median, or typical, growth rate in gross receipts among public charities from 2005 to 2014 confirms this finding. In 2014, the median growth rate was 2.7 percent compared with 2 percent in 2013 and 1.5 percent in 2012. In the years leading up the recession, the typical public charity’s gross receipts grew between 4 and 5 percent annually.
When will we see pre-recession growth rates again?
In short, 2014 was a good year for many public charities with nearly half seeing a slight or large increase in gross receipts and more than one-third seeing more than a 10 percent increase over the previous year. Nevertheless, with organizational growth rates still below pre-recession levels, the question remains—when will public charities see pre-recession annual growth rates again? A few positive reports leave us optimistic for continued growth into 2015. (registration required) predicted above average growth in giving during 2015, which would most likely translate into increased gross receipts at public charities. In addition, nonprofit hospitals saw net income grow in 2014 after several years of expenses outpacing revenues, leading Moody’s to upgrade nonprofit hospitals’ credit outlook from negative to stable, the first time it has been upgraded since 2008. However, with the S&P 500 and Dow Jones Industrial Average both finishing 2015 lower than they started—the first time this has happened since 2008—we may see a slower rise to pre-recession growth rates than we had hoped.