June 16, 2019; New York Magazine
At NPQ, we have written regularly about how we are living currently in what is effectively our nation’s Second Gilded Age. And now there are some new data from the Federal Reserve that reinforce just how stark the divisions between haves and have-nots have become.
As Eric Levitz writes in New York Magazine, with the Federal Reserve’s new Distributive Financial Accounts data series, “the central bank offers a granular picture of how American capitalism has been distributing the gains of economic growth over the past three decades.”
The figures, listed as percentage of national wealth, are laid out below. (The Federal Reserve reports data for each quarter—for readability’s sake, we have selected numbers at intervals.)
| Date | Top 1% (%) |
90-99% (%) |
50-90% (%) |
Bottom 50% (%) |
| 1989:Q4 | 23.6 | 37.4 | 35.2 | 3.8 |
| 1994:Q4 | 26.0 | 35.0 | 35.6 | 3.4 |
| 1999:Q4 | 28.4 | 35.2 | 32.9 | 3.5 |
| 2004:Q4 | 27.8 | 36.3 | 33.9 | 2.0 |
| 2009:Q4 | 28.0 | 40.6 | 31.3 | 0.1 |
| 2014:Q4 | 30.9 | 39.0 | 29.4 | 0.7 |
| 2018:Q4 | 30.9 | 38.9 | 29.1 | 1.2 |
Bottom line: At the end of 1989, the top ten percent of Americans had 61 percent of wealth and the bottom 90 percent had 39 percent. As of the end of 2018, the top ten percent had nearly 70 percent (69.8 percent) of wealth, the bottom 90 percent just over 30 percent (30.2 percent).
What does this mean? According to the Federal Reserve, total wealth in the US at the end of 2018 was $98.39 trillion. The top one percent alone saw its wealth share rise by 7.3 percent or $7.18 trillion. This works out to about $2.18 million more wealth per person within the elite top “one percent” group than would have been the case had its share of wealth remained constant.
Put another way, if the bottom 90 percent still had 39 percent of total wealth instead of 31 percent, on average each person would have an additional $28,750 in wealth—and the average a family of four would have a net worth that is $115,000 higher. In short, a lot of money has shifted.
Sign up for our free newsletters
Subscribe to NPQ's newsletters to have our top stories delivered directly to your inbox.
By signing up, you agree to our privacy policy and terms of use, and to receive messages from NPQ and our partners.
There are many ways to slice and dice the data. The top one percent, for instance, had $30.37 trillion in net worth as of the end of 2018. Since the current US population is about 329 million, that means the average (mean) net worth of a person in the top one percent is about $9.23 million. By contrast, the bottom 50 percent of the population had a total of $1.17 trillion in net worth, which works out to an average (mean) net worth per person just slightly over $7,000 (including consumer durables like cars; subtract those out and average net worth falls below zero).
Levitz references an observation from Vox’s Matt Yglesias that much of the explosion in wealth inequality can be traced to fact that the top one percent owns most stock and private equity. “The passive income generated by these assets,” Levitz says, “allowed the one percent to pull away from everyone else, even in the absence of soaring wage inequality.” Of course, this is one reason why changing who owns capital—through such means as employee ownership—is so important.
It’s hard to truly comprehend just how unequal the Federal Reserve numbers are. Consider that, according to the Fed data, the top one percent as a group have more than 25 times the net worth of the bottom 50 percent. But by definition there are 50 times as many people in the bottom 50 percent as in the top one percent. In other words, a single person in the top one percent has the wealth of more than 1,250 people in the bottom 50 percent.
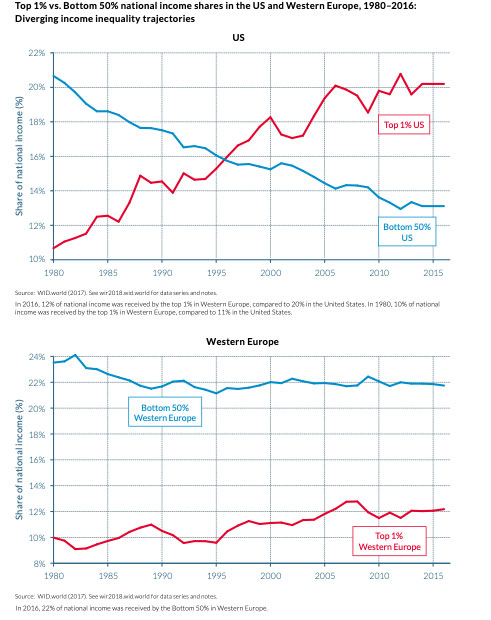
It is often suggested that inequality is a “natural” result of the rise of technology, the changing nature of work (cue the “gig economy”), and the internet, but data that Levitz cites from the 2018 World Inequality Report, penned by leading international economists including Thomas Piketty, author of Capital in the Twenty-First Century, puts these claims in doubt. As the below graphs show, while inequality has increased in both Western Europe and the United States, the increase of inequality in the United States has been dramatically greater:
Policy, in short, can have a major impact on the distribution of income and wealth. Last year, Jerome Powell, chair of the Federal Reserve (and a Trump appointee) declared at a US Senate Banking Committee hearing that the growth in inequality the Fed was finding was “very troubling.” Indeed. The point, however, is not simply to be troubled by these numbers but to change them.—Steve Dubb