July 9, 2019; Fast Company
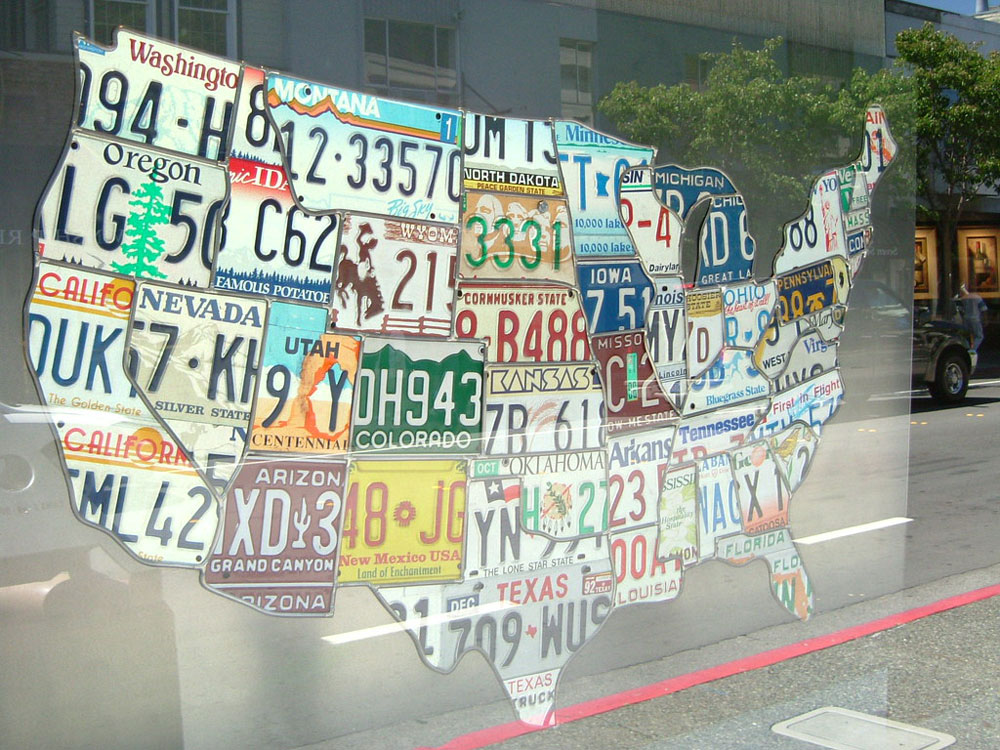
If you’ve been wondering how a nonprofit organization you work with fits into the bigger picture of work being done in your geographic area, new visualization maps produced by Civis Analytics might provide an answer. Based on 2018 IRS data from over 353,000 nonprofits across the country, the report is a fascinating snapshot of important national, state and even some local nonprofit trends—including funding.
It should be said that this deeper level of information has been made possible by a long hard struggle to make 990s machine-readable. (You can read about the roots of that effort here.) Many groups have worked collaboratively to create the data base this sector deserves, and we have been looking forward to the resulting research, which promises to make more meaning of our complex sector.
Civis Analytics is a data firm with a mission to democratize data science so organizations can stop guessing and make decisions based on numbers and scientific fact. One of their stated practice areas is advocacy and nonprofits, and they have a range of partners, some of which you have probably have heard of.
As an introduction to this study, Civis explains that at the end of 2018, they were looking at some 990s and thought it would be cool to share their findings more broadly with the general public (they are data people). They used a machine-readable version of the 990 to collect data from over 353,000 nonprofits and applied a “topic-modeling method” to analyze mission statements based on key words and phrases to categorize the organizations in their sample. The team then assigned each nonprofit to one or more categories and then compared the financials of organizations by category and location.
Sign up for our free newsletters
Subscribe to NPQ's newsletters to have our top stories delivered directly to your inbox.
By signing up, you agree to our privacy policy and terms of use, and to receive messages from NPQ and our partners.
Some of the results might not come as a surprise. According to the study, for example, organizations that serve vulnerable populations—children, people with developmental disabilities, and seniors needing long-term care, as examples—are the most common type of organizations in the majority of states. More surprising is the finding that youth character development organizations are the most common organizations on the West Coast, that economic development organizations are the most common type of organization in North Dakota, Wisconsin, Maryland, Virginia, and Michigan and that organizations dedicated to affordable housing are the most common in Louisiana and Indiana.
The study highlights issues related to funding and draws attention to the challenging fact that the most common organizations are not always the best funded. Civis found that nonprofits dealing with healthcare, specifically nonprofit health plans and universities with large medical centers, are “by far the biggest, both in terms of total revenue across the sector as well as average revenue per organization.” The study also includes the interesting wrinkle that although health care organizations are the most well-funded organizations nationally, in some parts of the Midwest (Michigan, Illinois, Minnesota, and Arkansas) and parts of the Southwest (Nevada and New Mexico), mutual assistance associations focused on benefits and insurance have the highest average revenue. Minnesota and California pop up in the study as states with the welcome designation of being home to some of the country’s most well-funded nonprofits.
The study also provides a close look at the needs within the country’s most populous cities and notes that organizations dealing with youth character development, vulnerable populations, scholarships and economic development dominate in those areas. The cultural focus of both New York City and Philadelphia are also confirmed: in New York City, culture is one of the four most common organization types and in Philadelphia, cultural organizations have the second highest average revenue.
Regarding the question of applicability of CIVIS’s findings from this study, Scarlett Swerdlow, director of applied data science, told Fast Company, “This might be a way [for organizations or funders] to identify any gaps in services.” Although the study that is available to the general public as a download doesn’t include organization names, it still serves as a useful indication of recent national trends.
Meanwhile, nonprofits should be asking themselves what questions they’d want to see posed, because this new data capacity is the people’s.—Anne Eigeman