April 6, 2015;WBAL-TV
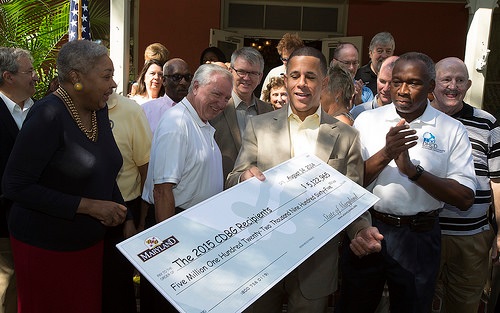
This week is National Community Development Week, meant to recognize and underscore the importance of the Community Development Block Grant (CDBG) program, now 41 years old, and the HOME program, in its 24th year, both critical resources for improving inner city neighborhoods and rural communities for the benefit of low- and moderate-income residents. Providing sample resolutions for city councils to pass, the National Community Development Association invented and now spearheads the event.
It probably isn’t the Association’s fault, but this year’s effort with an eye toward getting CDBG and HOME appropriations boosted after years of being chipped away at in federal budgets happens to have been scheduled for a week when Congress is on recess. Those gallivanting members of Congress are responsible for having let CDBG and HOME suffer reductions year after year despite the importance of those resources to neighborhoods—and to neighborhood-based nonprofits. NCDA points out that CDBG appropriations have declined from $3.99 billion in Fiscal Year 2010 to $3.0 billion today and HOME from $1.825 billion to a current, comparatively paltry $900 million.
The CDBG funding picture is a little worse than it even appears in the NCDA numbers. The exact numbers from HUD show that both entitlement communities (central cities in Metropolitan Statistical Areas with populations of at least 50,000 and urban counties with populations of at least 200,000 excluding the population of otherwise qualifying entitlement) and smaller non-entitlement communities have been cut to pretty tough levels considering the dire needs of many neighborhoods:
|
|
2012 |
2013 |
2014 |
2015 Enacted |
|
Community Development Block Grants (CDBG) |
||||
|
Entitlement |
2,058,763 |
2,149,837 |
2,116,100 |
2,095,100 |
|
Non-Entitlement |
882,327 |
921,358 |
906,900 |
897,900 |
|
Subtotal |
2,941,090 |
3,071,195 |
3,023,000 |
2,993,000 |
|
Insular Areas |
7,000 |
7,000 |
7,000 |
7,000 |
|
Set Asides – (PIH) Native Americans |
60,000 |
56,862 |
70,000 |
66,000 |
|
Total CDBG |
3,008,090 |
3,135,057 |
3,100,000 |
$3,066,000 |
Sadly, funding for CDBG is back to roughly the same level as when President Gerald Ford proposed his first appropriations for the program four decades ago.
Sign up for our free newsletters
Subscribe to NPQ's newsletters to have our top stories delivered directly to your inbox.
By signing up, you agree to our privacy policy and terms of use, and to receive messages from NPQ and our partners.
While it is obvious that a large slice of CDBG and just about all of HOME funding goes to the creation and support of affordable housing—28 percent of the CDBG funds directed toward entitlement communities and 10 percent spent in non-entitlement communities—the support for CDBG should be much broader than just “housers.” In FY2013, 14 percent of CDBG expenditures in entitlement communities went to support “public services.” The breakdown of the types of public services supported in that $344.4 million (for entitlement communities and an additional $21.8 million for non-entitlement) expenditure included the following, as measured in the number of persons who benefit:
|
CDBG Funded Public Services—FY2013 (by number of persons benefitting) |
|
|
Public services (gen’l) |
4,634,348 |
|
Homeless/AIDS patients programs |
483,439 |
|
Senior services |
1,028,066 |
|
Services for the disabled |
81,000 |
|
Legal services |
41,481 |
|
Youth services |
940,051 |
|
Transportation services |
330,569 |
|
Battered and abused spouses |
129,587 |
|
Employment training |
71,047 |
|
Crime awareness/prevention |
40,047 |
|
Fair housing activities |
93,072 |
|
Child care services |
59,324 |
|
Health services |
511,277 |
|
Abused and neglected children |
51,562 |
|
Mental health services |
80,114 |
|
Subsistence payments |
32,326 |
|
Food banks |
1,116,542 |
|
Other public service activities |
71,636 |
Additionally, in FY2013, CDBG funding went into the creation of public facilities such as homeless shelters, childcare centers, senior centers, parks and recreational facilities, and health facilities.
Haven’t heard the Community Development Week buzz yet? Not surprising. So far, in national press coverage, there have been reports on local municipal governing bodies issuing variations on the NCDA-recommended resolutions attesting to the importance of CDBG and HOME, which get reported pretty much as city councils going through the motions. Perhaps another reason CDBG isn’t getting a lot of coverage is that many municipalities still use their CDBG funds under the catch-all “removal of slums and blight” criterion to bulldoze lower income neighborhoods to make way for mixed-use developments, hardly a strategy to get significant support from inner-city residents who are losing their homes in urban renewal strategies. Maybe people are too aware how some mayors use the capped 15 percent allowed for public services as a local human services nonprofit “survival of the fittest” competition, getting nonprofits to focus on that relatively small part of the CDBG appropriation while letting the bulk of the money devoted to housing and redevelopment escape attention. Or maybe it is because so much of the community development week celebration seems to leave municipalities’ nonprofit partners on the sidelines.
Take this from someone who used to oversee the allocation of CDBG funds for a mid-sized city. If there is a more important and more flexible resource for multifaceted community development available for community organizations around the nation, we haven’t seen it. Thoughtful municipal administrators can and sometimes actually do use their CDBG resources as a crucial tool in building and strengthening community-based nonprofits dedicated to long-term neighborhood revitalization. National Community Development Week should mean that the importance of CDBG funding potentially directed toward the programs and facilities ought to be ratcheted up on the nonprofit sector’s advocacy agenda, not just during Congress’s vacation week, but whenever human service nonprofits, housing and community development nonprofits, and their state nonprofit associations plan their own lobbying efforts.—Rick Cohen


