This is the second of a four-part series from the winter 2019 edition of the Nonprofit Quarterly, addressing the decline of small and medium-sized donor households. NPQ considers this issue an urgent matter for the entire sector.
In 2016, 53.9 percent of American households donated something to a legally recognized charity. This is down 1.5 percentage points from the prior wave of data in 2014, 11.5 percentage points since the Great Recession, and almost 14 percentage points from the peak level, in 2002. In other words, one in five former donors in the early waves of the study are now not giving anything to legal charities in any given year.
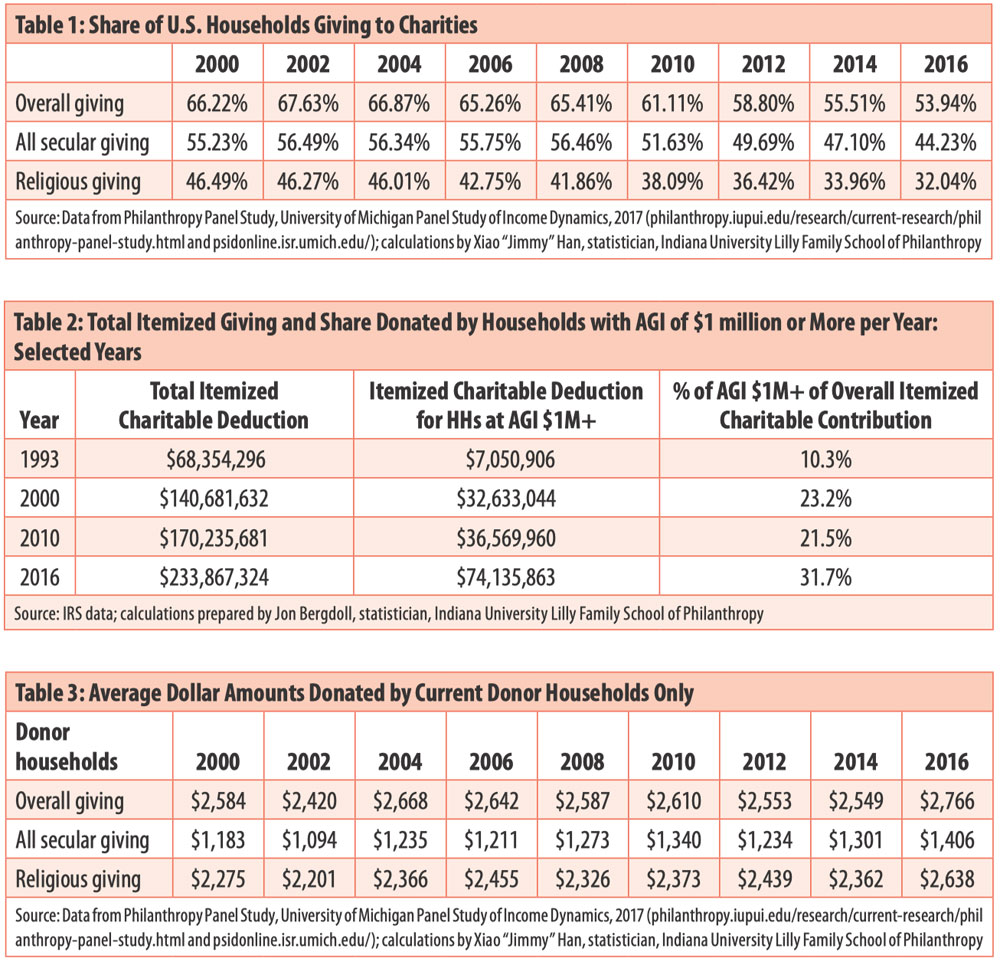
Table 1 (see further down) shows that the share of Americans giving at all to 501(c)(3)s continues to erode. (Note that the dataset used by this table represents the bottom 92 percent of U.S. households for income and bottom 97–98 percent of households for wealth. The panel does not include enough observations in the top 2–3 percent of income earners to be representative.)1
Meanwhile, big donors are playing an even bigger role than in earlier years. First, itemized giving by those with an adjusted gross income (AGI) of $1 million or more in any given year has grown dramatically over the last couple of decades (see Table 2)—in fact, it has more than tripled, from 10.3 percent in 1993 to 31.7 percent in 2016 (the most recent year available from the IRS of highest income earners). It is also up two percentage points from 2015, when it was 29.8 percent.
There is no doubt that the change in the tax laws will affect this picture moving forward (as the number of itemizers plummets, given the tax bill changes);2 but the trend of the very highest income earners accounting for dramatically larger shares of total giving does not seem likely to change.
In an article published by the Nonprofit Quarterly in fall 2018—“The Growth in Total Household Giving Is Camouflaging a Decline in Giving by Small and Medium Donors: What Can We Do about It?”—I demonstrated that small donors were disappearing and larger donors were increasing their share of giving.3 Now I provide evidence that these trends are continuing—if not accelerating—and I briefly articulate some ideas on what might be done to ameliorate these challenges.
Where Have All the (Small) Donors Gone?
Let’s review some updated data on these trends to the extent feasible. This decline in donorship holds true for giving overall, gifts to congregations (labeled “religious giving”), and gifts to other (non-congregational) charities (labeled “all secular giving”)—setting aside for now the fact that many gifts categorized as secular gifts are actually donated based on religious values and/or to religiously affiliated charities, but ones whose primary mission is not faith fulfillment, so they are labeled perhaps too generically as secular.4
Giving to other charities (labeled “secular giving”) is down almost three percentage points from the prior wave (2014) to the most current wave (2016). Secular giving is down over twelve percentage points from its peak before the Great Recession. As a rate of change, this means that 22 percent fewer households are donating at all to these non-congregational charities. (See Table 1.)
Giving to congregations has trended down with each additional wave of the panel study. In 2016 (the most recent year for which these data are available), the share of households giving to congregations is down to 32 percent, which is almost two percentage points lower than the prior wave in 2014, and almost ten percentage points lower than before the Great Recession. It is 14.5 percentage points lower than when the panel started, in 2000. An alternative way of expressing this is that almost one-third fewer American households are donating to congregations in the most recent panel wave in 2016 than they did in the first wave in 2000.
On the other hand, when we look at only those households who donated in any given year, we see that they are actually increasing how much they give each year both to congregations and to other charities, hence to overall giving as well (see Table 3). This trend has been characterized elsewhere as “donors down, dollars per donor up.”5 Given the uniformity of this trend, I will let Table 3 speak for itself.
The Big Donors Are Getting Bigger
As I described earlier, the share of itemized donations by very high-income households tripled between 1993 and 2016. That paints a vivid picture, but there are several other factoids that triangulate to this truth of the growing share of big donors in total household giving. First, I review the Chronicle of Philanthropy’s list of the top fifty donors and its subset of the top ten donors from 2000 to 2018. Second, I examine the explosive role of DAFs, both in the dollar volumes and as a share of household giving. Finally, I look at comparative evidence from available research around the world to ascertain whether these trends in the United States parallel similar phenomena globally.
Not only are the bigger donors getting bigger—the biggest donors are also getting to be even “more biggest” (bad grammar intended for dramatic effect; apologies to all of my prior English faculty). Table 4 shows total giving by the top fifty largest and top ten largest donors as reported annually by the Chronicle of Philanthropy,6 as well as total giving and total household giving (both from Giving USA).7
My research team and I have combined these two distinct data series to calculate the giving by the top fifty and top ten donors each year as a share of total household giving. We have created a subset of the Chronicle’s top fifty donors to examine how similar or different the top 10 percent of donors are compared to the rest of the top fifty (i.e., the “bottom forty” donors in the top fifty). (See Table 4.) It’s important to note that the top fifty data only go back to the year 2000, so definitive estimates of longer-term trends are not possible; but some interesting factoids emerge from these data.
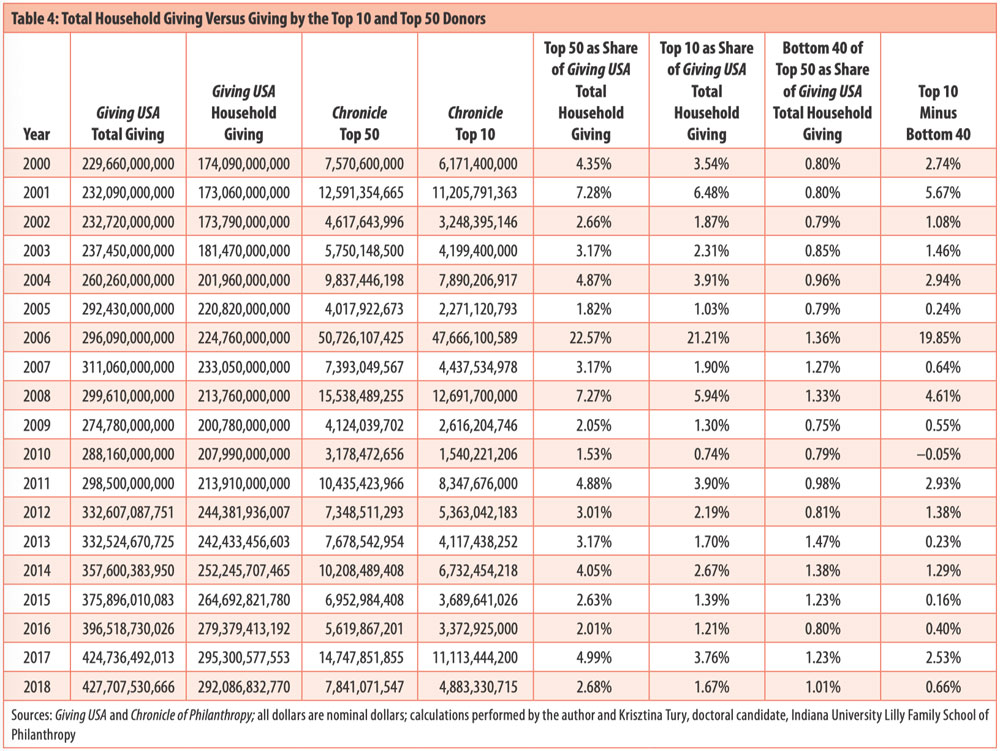
First, the top ten donors of the top fifty account for an average of 78 percent (mean versus 69 percent for the median) of the total giving by the top fifty donors. Second, in all but one year, the top ten donors gave more than the next forty combined. Third, in that year (2010), the top ten still accounted for 48.5 percent of the total giving by the top fifty. Fourth, and perhaps not surprisingly, there is a great deal of volatility in the year-to-year amounts given by the top fifty. While some of these donors are repeat donors, others are givers of bequest gifts, which by definition are one-time gifts. Fifth, the top fifty donors play an important role in household giving, ranging from 1.5 percent to 22.6 percent of total household giving in any given year. The top ten donors ranged from 0.7 percent to 21.2 percent of total household giving. While Table 4 shows some dramatic swings (e.g., Warren Buffett’s big gifts), it also shows that even among the top fifty donors, the biggest donors (top ten) account for a disproportionate share of the dollars donated by the top fifty.
Evidence from Donor-Advised Funds
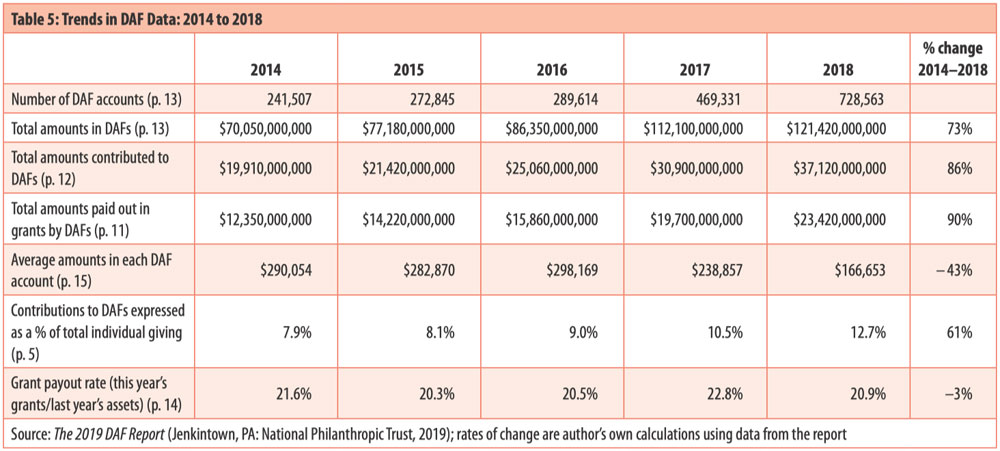
While some donor-advised funds (DAF) hosts are trying to create a more democratized version of DAFs with lower entry requirements, it is clear that DAFs are growing and that they remain largely the realm of large donors. According to the most recent report from the National Philanthropic Trust on DAFs in 2019, between 2014 and 2018 the number of DAF accounts more than tripled (202 percent)!8 (See Table 5.) This growth has been going on for years, but has accelerated since the tax code was being discussed and then enacted: The number of accounts grew 62 percent from 2016 to 2017, and then another 55 percent from 2017 to 2018—or 152 percent growth from 2016 to 2018 combined!
The dollar amounts contributed to new and existing DAF accounts have also grown rapidly over the last five years (86 percent), but not nearly as rapidly in the past two years as the number of accounts: 48 percent growth in total amounts contributed to DAFs versus 152 percent growth in the number of DAF accounts from 2016 to 2018. The changes in the tax code combine to make it unlikely that most giving households will be able to deduct their charitable gifts, including most of the tax filers who were itemizers in prior years.
The key factors driving most former itemizers into becoming non-itemizers moving forward are the near doubling of the standard deduction and the effects of the state and local taxes (SALT) limits. Clearly, many middle-, upper-middle-, and lower-upper-income households have reacted to the expected loss of their tax itemization status by creating a DAF account (or expanding one already in place). This may be a strategy to “bundle” multiple years’ worth of gifts into one year, thereby creating a large enough deduction in some years to move back to tax itemization status. This would permit the deductibility of the same donations—even if not on an annual basis.
Sign up for our free newsletters
Subscribe to NPQ's newsletters to have our top stories delivered directly to your inbox.
By signing up, you agree to our privacy policy and terms of use, and to receive messages from NPQ and our partners.
The total amounts in DAFs have also grown dramatically over the last five years (73 percent), as have the total amounts paid out in grants (90 percent). (See Table 5.) There are two indicators that have declined over the last five years—dips that seem to be related to the tax-bill effects of tremendous growth, as well. For example, the average amount in each DAF account dropped 43 percent from 2014 to 2018, but all of the decline occurred over the last two years (a 44 percent drop from 2016 to 2018). This effect may be attributable to the following possibilities: The fact that many DAF host organizations have lowered the cost of entry in order to attract new clients; the very high payout rates that many DAF accounts persist in giving; and/or the dilution effects of so many net new DAF accounts formed so rapidly. The second negative signal from the burst in growth in DAF accounts is the modest decline in the grant payout rate over the last five years, from 21.6 percent in 2014 to 20.9 percent in 2018. While there are many potential definitions for payout rates, National Philanthropic Trust employs the commonly used definition for foundation payout rates in these calculations (this year’s grants divided by last year’s total assets, or [grants(year t)/total assets (year t-1)]). While the payout rate bumped up a bit in 2017 (to 22.8 percent), the five-year average has been 21.2 percent, and most years have been within one percentage point of that five-year average.
The facts are that there are over $121 billion dollars in DAF accounts and over $23 billion in new contributions from DAF accounts were given in 2018 (see Table 5). Grants made to charities from DAF accounts totaled the equivalent amount of 12.7 percent of total household giving in 2018, which is up dramatically from 7.9 percent in 2014—and almost three times its share in 2010 (4.4 percent). The increase in the number of DAF accounts, their total assets and grants, and, especially, the overall “market share” of DAFs as a percentage of household or individual giving demonstrate the growth of “bigger” or “big” donors. This, combined with the reality that we simultaneously saw a decline in the participation rates in giving by the small donors, reinforces the notion of the growth of the big donors and the disappearance of the small donors.
Fidelity Charitable’s latest giving report indicates not only tremendous growth in charitable contributions over time—from $1.1 billion in 2009 to $5.2 billion in 2018 (41 percent per year average annual growth in the dollar amounts in DAF grants from 2009 to 2018) just from Fidelity Charitable’s DAF accounts—but also the scale of these gifts: grants of $1 million or more grew to 582 last year (15 percent over the prior year).9 Also of interest: According to Fidelity’s data, only 3 percent of these DAF gifts last year were completely anonymous.10 Furthermore, while just over one-third (37 percent) of the DAF gifts were granted within a year, 74 percent were granted within five years and 88 percent within a decade.11 While it is quite reasonable to be concerned about the theoretical aspects of a “parking lot” phenomenon, in reality, these micro, account-level data from Fidelity and the aggregated payout rates reported by the National Philanthropic Trust suggest that this criticism of DAFs is an exaggeration wrapped up in a hyperbole (or vice versa, as one prefers).
Impact of Policy Changes on Philanthropy
Public policies, including tax policies, are meant to reflect the will of the public and to create incentives for desirable behaviors; create disincentives for undesirable behaviors; and provide for public goods (e.g., national defense, clean air and water, etc.) and infrastructure (e.g., schools, roads, bridges, airports, harbors, etc.), as well as the means of funding these endeavors (e.g., income taxes, property taxes, capital gains taxes, tolls, and other user fees).
The historical ability of Americans to deduct their charitable donations reflects our social values to decentralize decision making about the level of funding for some types of public goods, encourage prosocial behaviors (i.e., good deeds), and provide an incentive to fund public goods voluntarily. As has been discussed elsewhere (The Conversation, Nonprofit Quarterly, etc.), the most recent tax bill contains several elements that are likely to affect private philanthropy, but nearly all are likely to have a deleterious effect on philanthropy—at least in the short run. Key components of this include the following:
- Lowering the top marginal tax bracket for households, which lowers the after-tax value of a household donation. Since this rate change was small, its likely effect is also small.
- Near-doubling of the standard deduction means that most households who had been itemizers in the past will be non-itemizers in the future. Given that this represents a 66.7 percent price increase for donations by those who had been itemizers in the top tax bracket before and are now non-itemizers (see math examples below, near end of this section), it is expected that this will have a meaningful and persistent negative effect on household giving—holding everything else constant (e.g., growth in incomes, GDP, etc.).
- The SALT caps make it even more likely that former itemizers will become non-itemizers. Again, this would create an increase of 66.7 percent in the price of making a donation—or the after-tax cost of giving.
- The doubling of the exemption levels for the estate tax means that even fewer households will be subject to the estate tax, which makes it less likely that some households will make charitable bequest gifts.
- The large drop in the top corporate tax rate raises the after-tax cost of corporate giving.
Theoretically, these tax effects are mixed: Tax rate cuts put more money in the pockets of taxpayers, which could be donated immediately, thereby potentially increasing charitable giving (“income effects,” in economics-speak); on the other hand, tax rate cuts raise the after-tax price of giving (price effects), which may diminish giving. Given these opposing potential effects, the actual effects must be measured empirically. There are several pieces of evidence that suggest that the tax bill will have a net negative effect on giving. First, research commissioned by Independent Sector and conducted by the Lilly Family School of Philanthropy estimated that the tax bill would be likely to reduce household giving by 4.6 percent.12 Similar results were found by other scholars and policy analysts (e.g., Urban Institute, American Enterprise Institute, and the Tax Policy Center).13
This year’s results outlined in Giving USA 2019 show the first evidence of the impact of the tax bill on household giving.14 In spite of the fact that disposable personal income (DPI), which is after-tax income, and gross domestic product (GDP) grew by at least 5 percent in 2018 over 2017, household giving fell by an estimated 3.4 percent.15 Given the fact that we would have anticipated a robust growth in household giving paralleling if not equal to the growth in personal income, and given that the other main factor was the tax bill, the Giving USA 2019 findings suggest that our earlier estimates of the likely effects of the tax bill were pretty much “on the money.”16 We had estimated a larger decline for the net-net effects of the tax bill than what was found in Giving USA 2019, but the estimate of the tax bill effects was made holding growth in income and GDP constant—essentially asking what would happen purely as a result of the change in tax regime. Clearly, the robust growth in GDP and DPI and other tax-cut-related income effects were dominated by the negative effects on the price of giving resulting mostly from the doubling of the standard deduction and the SALT caps.
As reported elsewhere (e.g., Nonprofit Quarterly, The Conversation, Independent Sector-Indiana University research reports), the tax bill had several aspects that were nearly all likely to have a deleterious effect on philanthropy—holding everything else constant.17 (The one exception to this is the increase in the share of income that households can deduct in any given year, from 50 percent to 60 percent. Obviously, this does not affect many—if any—households in any given year.) First, the small decrease in the top marginal tax rate (MTR) was likely to have a small, negative effect on household giving. Second, the near doubling of the standard deduction meant that most tax itemizers in earlier years would become non-itemizers, which meant that their after-tax price of giving would increase dramatically.
For example, in 2017, it cost approximately $60 for an itemizer in the top tax bracket to donate $100—i.e., ($100 × (1 – MTR)) = ($100 × (1 – .396)) = $60. If now a non-itemizer, it costs $100 to donate $100, which is a 66.7 percent price increase—((($100 – $60) / $60) × 100) = 66.7 percent. While people donate for many reasons, and taxes may be near the bottom of the list, anyone facing a price increase of 66 percent might reevaluate whether to buy that “good” at all, and, if so, how much of it. Arguably, charitable donations could be considered “luxury goods” (i.e., they are not needed to live, and generally increase with income and wealth), rather than “necessities” (i.e., needed to live). One would expect that the “price sensitivity” (or elasticity of demand, in economics) would be greater for luxury goods than necessities.
In addition, the elimination of personal exemptions will be a downdraft for families with more than two or three children. Finally, the SALT limits make it even more likely that more households would be non-itemizers, which makes it more costly for more households to donate. In fact, the early signals from the IRS are that the number of itemizers dropped to approximately 10 percent.18
The doubling of the exemption of the estate tax was unlikely to have an effect on giving this past year. In order to have had an effect, an estate would have to fall in between the old exemption level and the new one, the will would have to have been changed to drop the bequest gifts, and the person would have to have died last year (2018). I am sure there are a few folks who fit into that list, but not many. The net effect long term is less certain, as people make bequest gifts for many reasons—but it is clear that the estate tax will only apply to the very wealthiest of households. If making bequest gifts to avoid the estate tax was all or part of many households’ motivation for making an estate gift, then we can expect that the doubling of the estate tax exemption levels will have a negative effect on bequest giving over time.
International Evidence
There is evidence that some of the trends we are observing in the United States are occurring globally, with documented evidence in the United Kingdom, Australia, the Netherlands, and Canada. In the United Kingdom, there is a parallel pattern of donors down, dollars per donor up. According to the latest study by the Charities Aid Foundation (CAF UK Giving 2019 report), the proportion of people giving to charity has decreased for three years in a row (from 69 percent in 2016 to 65 percent in 2018).19 But since those who gave donated higher amounts, the total amount in 2018 remained largely the same as in the previous year. (Charities Aid Foundation conducts an online survey every month with one thousand respondents.)
According to Marie Crittall, Myles McGregor-Lowndes, and Denise Conroy, the percentage of people donating in Australia has been decreasing since 2010–2011.20 These data are based on tax returns. The latest Dutch data on giving came out in 2015,21 then the research stopped for a couple of years due to funding problems. The next report will be available in spring 2020.22 What we know is that giving as a proportion of income declined by one-fifth between 1999 and 2015, based on the Giving in the Netherlands Panel Survey.23 In 2013, 88 percent of Dutch households donated to charities, and 85 percent did so in 2011.24 In Canada, according to a Fraser Institute report, the percentage of tax filers donating to charity dropped between 2006 and 2016, from 24.6 percent to 20.4 percent.25
Whether these initial pieces of data from these five very different countries (five is counting the United States) are a coincidence, a short-term aberration, an early indicator of future trends, or correlated in ways not yet understood is unknown/unknowable. However, collectively, they stimulate concerns that we may be on the leading edge of a disconcerting trend that might be global as well as national.
Conclusions and Recommendations
Big donors have grown, and small and medium-sized donors have gone away. Empirically, this does not seem to have hurt total giving much in the recent past. However, what happens in the long run? Will bigger and bigger donors continue to bail out philanthropy? Will the elimination of the tax deduction for most former tax itemizers continue to erode household giving? What’s the effect of declining participation rates in giving on our democracy and civil society when fewer people give than those who do not? Are we concerned about democracy in America? What happens if we shift from most Americans giving to most not giving? Here are my top conclusions and recommendations:
- Our prior research for Independent Sector showed that the universal charitable deduction (UCD) would increase household giving more than the loss in giving from the tax bill.
-
- Variations of this proposal have been supported in both the House and the Senate, and have been sponsored by members of both of the main political parties. However, they have not yet gained much traction.
- Similarly, we have estimated that a 25 percent tax credit would more than offset the philanthropic decreases associated with the tax bill.
-
- A tax credit would also address the equity concerns that some have raised about the itemized charitable deductions: A tax credit would create the same dollar-value reduction in federal income taxes owed for anyone—regardless of their income or MTR—whereas the value of a tax deduction for a charitable gift grows with incremental income as the MTR increases with higher levels of taxable income.
- For example, with a tax credit, a gift of $1,000 would create a $250 tax credit whether one was in the lowest or the highest MTR; however, a tax deduction from the same $1,000 gift might produce as little as a $100 deduction (for those in the 10 percent tax bracket) or as much as a $370 deduction (for those in the current top tax bracket of 37 percent). Clearly, these are producing some unequal outcomes.
- Another meaningful policy change that would encourage philanthropy would be to tax capital gains income as ordinary income after adjusting for inflation.
-
- This would create new incentives for people to donate appreciated assets, and would improve both horizontal equity (treating likes alike) and vertical equity (treating people of different incomes fairly). The rate increase would also encourage philanthropic gifts in the year of liquidation (if the person elected not to donate the appreciated asset itself), as the donor could benefit from the deduction at the higher MTR.
- It would improve horizontal equity: Income is income, regardless of source, so taxing it the same would be fair in this regard.
- It would also enhance vertical equity. Recall Warren Buffett’s comments about how unfair it was that his tax rate was lower than that of his executive assistant. His was lower because of a legal loophole that taxed most of his income as capital gains, but his assistant’s income was taxed at the rates for ordinary income.26
- Capital gains tax rates for assets held over a year are either 0 percent, 15 percent, or 20 percent (depending on your taxable income and filing status). Capital gains are taxed at lower rates than ordinary income at every level, but that gap gets larger as one’s share of income from capital gains grows.
- Another simple policy change would be to implement economist C. Eugene Steuerle’s suggestion of being able to deduct charitable gifts in spring of the following year while doing one’s taxes—like a Roth or an IRA.27
-
- This would be useful because if someone had more taxable income than expected for any reason, they could maximize the tax deduction by claiming it for a year when they had a higher MTR.
- This would be even more important if a universal charitable deduction or a universal charitable tax credit were implemented, as all Americans would be able to utilize that strategy.
…
I think it is important to point out the trends vis-à-vis our growing reliance on big donors and megadonors in our philanthropic landscape, and to acknowledge the concerns about the disappearance of the small and medium donors. I, for one, am grateful that the wealthy and the very wealthy are voluntarily sharing some of their wealth with the rest of society. Some have argued that those dollars should be taxed, but the fact is the charitable deduction has been part of the tax code for one hundred years—nearly as long as there have been federal income taxes. In addition, the public policy trend over the last sixty years or so has been predominantly to lower top marginal tax rates. Perhaps we might be better served to close some of the tax loopholes that allow hedge-fund billionaires to pay a lower effective tax rate than those earning just above the minimum wage, rather than discouraging wealthy households from donating.
While the top fifty donors—and especially the top ten donors—make gifts that seem staggering to most of us, in the median year the top fifty donors accounted for only 3.2 percent of total household giving that year. While these gifts are immense, and perhaps newsworthy, they do not dominate the philanthropic flows in the same manner as the headlines might suggest. While some households face tough choices at times and elect not to donate in any given year, some of our forthcoming research has shown that over a longer period of time, at least 87 percent of American households donated something at least once over the prior decade, and many donate in most years.
It is also important to recognize that philanthropy includes a wide range of voluntary actions for the public good beyond gifts of money to legal charities. These might include gifts of cash to help friends, neighbors, relatives, and/or others in need, or volunteering time to help at a charity or help a friend or neighbor. Our civil society contributions might also embrace such actions as voting, protesting, and forming movements to “get out the vote.” In these ways, households of all income levels can and do participate in our civil society.
The author would like to acknowledge the following individuals for help in gathering and tabulating data presented in this essay: Jon Bergdoll, statistician; Xiao “Jimmy” Han, statistician; and Krisztina Tury, doctoral candidate—all from the Indiana University Lilly Family School of Philanthropy, IUPUI. The views in this essay are strictly the author’s own. They do not necessarily reflect the views of the Lilly Family School of Philanthropy, IUPUI, or Indiana University more generally.
Notes
- Mark O. Wilhelm, “The Quality and Comparability of Survey Data on Charitable Giving,” Nonprofit and Voluntary Sector Quarterly 36, no. 1 (March 2007): 65–84; and Mark O. Wilhelm, “New data on charitable giving in the PSID,” Economics Letters 92, no. 1 (July 2006): 26–31.
- “What are itemized deductions and who claims them?,” Tax Policy Center, Urban Institute & Brookings Institution, accessed September 6, 2019.
- Patrick M. Rooney, “The Growth in Total Household Giving Is Camouflaging a Decline in Giving by Small and Medium Donors: What Can We Do about It?,” Nonprofit Quarterly 25, no. 3 (Fall 2018): 44–49.
- Melanie A. McKitrick et al., Connected to Give: Faith Communities (Santa Monica, CA: Jumpstart Labs, 2013).
- See Patrick M. Rooney, Xiaoyun Wang, and Mark Ottoni-Wilhelm, “Generational Succession in American Giving: Donors Down, Dollars Per Donor Holding Steady But Signs That It Is Starting to Slip,” Nonprofit and Voluntary Sector Quarterly 47, no. 5 (October 2018): 918–38.
- “Philanthropy 50,” Chronicle of Philanthropy, accessed September 6, 2019.
- Giving USA, Giving USA 2019: The Annual Report on Philanthropy for the Year 2018 (Chicago: Giving USA, 2019), 21. (Note: Giving USA 2019 page numbers refer to a preprint PDF; page numbers may change when the report has been published in its final, bound form.)
- National Philanthropic Trust, 2018 Donor-Advised Fund Report (Jenkintown, PA: National Philanthropic Trust, November 2018).
- Fidelity Charitable, 2019 Giving Report (Cincinnati, OH: Fidelity Charitable, 2019), 6.
- Ibid., 8.
- Ibid., 11.
- Patrick M. Rooney et al., Tax Policy and Charitable Giving Results (Indianapolis, IN: Indiana University Lilly Family School of Philanthropy at IUPUI, 2017); and Indiana University Lilly Family School of Philanthropy, Charitable Giving and Tax Incentives: Estimating changes in charitable dollars and number of donors resulting from five policy proposals (Indianapolis, IN: Indiana University Lilly Family School of Philanthropy at IUPUI, 2019). It is worth noting that the effect is an overall net outcome for household giving, but the majority of the change is attributable to the loss of tax deductibility for those who shift from being itemizers to becoming non-itemizers.
- See Rooney et al., Tax Policy and Charitable Giving Results; Alex Brill and Derrick Choe, Charitable Giving and the Tax Cuts and Jobs Act (Washington, DC: American Enterprise Institute, June 2018); John Ricco, “TCJA Projected to Lower 2018 Charity Giving by $22 billion,” Budget Model (blog), Penn Wharton, University of Pennsylvania, July 20, 2018; Tax Foundation, Preliminary Details and Analysis of the Tax Cuts and Jobs Act, Special Report 241 (Washington, DC: Tax Foundation, December 2017); Briefing Book: A citizen’s guide to the fascinating (though often complex) elements of the US tax system (Washington, DC: Urban-Brookings Tax Policy Center, Urban Institute & Brookings Institution, 2017); Roger Colinvaux, Brian Galle, and Eugene Steuerle, Evaluating the Charitable Deduction and Proposed Reforms (Washington, DC: Urban Institute & Brookings Institution, 2012); William G. Gale et al., Effects of the Tax Cuts and Jobs Act: A preliminary analysis (Washington, DC: Urban Institute & Brookings Institution, 2018); Joseph Rosenberg and Philip Stallworth, “The House Tax Bill Is Not Very Charitable to Nonprofits,” TaxVox (blog), Tax Policy Center, Urban Institute & Brookings Institution, November 15, 2017; and Tax Policy Center, Distributional Analysis of the Conference Agreement for the Tax Cuts and Jobs Act (Washington, DC: Urban Institute & Brookings Institution, December 18, 2017).
- Giving USA 2019, 21. (Note: Giving USA 2019 page numbers refer to a preprint PDF; page numbers may change when the report has been published in its final, bound form.)
- ; see also 73–74 and 79–81.
- Author’s own conclusion based on research from Giving USA and research done for Independent Sector.
- See, for example, Indiana University Lilly Family School of Philanthropy at IUPUI, Charitable Giving and Tax Incentives; see also all sources in note 13.
- “What are itemized deductions and who claims them?”
- Charities Aid Foundation, CAF UK Giving 2019: An overview of charitable giving in the UK (Kent/London: Charities Aid Foundation, May 2019), 5.
- Marie Crittall, Myles McGregor-Lowndes, and Denise Conroy, “Individual giving: A decade of change in Australia?,” Third Sector Review 25, no. 1 (2019): 1–26, ISSN: 1323-9163.
- René Bekkers, Arjen de Wit, and Suzanne Felix, “Twenty Years of Generosity in the Netherlands” (Paper presented at the 8th ERNOP Conference, Copenhagen, July 14, 2017); and René Bekkers, Theo N. M. Schuyt, and Barbara M. Gouwenberg, eds., Giving in the Netherlands 2015: Donations, Bequests, Sponsoring and Volunteering (Amsterdam: Reed Business, 2015).
- “Research on giving in the Netherlands continues, funding secured,” News, Center for Philanthropic Studies, August 19, 2019.
- Bekkers, de Wit, and Felix, “Twenty Years of Generosity in the Netherlands”; and Bekkers, Schuyt, and Gouwenberg, eds., Giving in the Netherlands 2015.
- Ibid.
- Milagros Palacios and Jake Fuss, Generosity in Canada and the United States: The 2018 Generosity Index (Vancouver: Fraser Institute, December 2018).
- Chris Isidore, “Buffett says he’s still paying lower tax rate than his secretary,” CNN Money, March 4, 2013.
- Eugene Steuerle, “Real Charitable Choice,” Tax Notes, July 26, 2004, reprinted by Urban Institute with permission.