This article is from the Nonprofit Quarterly’s fall 2016 edition, “The Nonprofit Workforce: Overcoming Obstacles.”
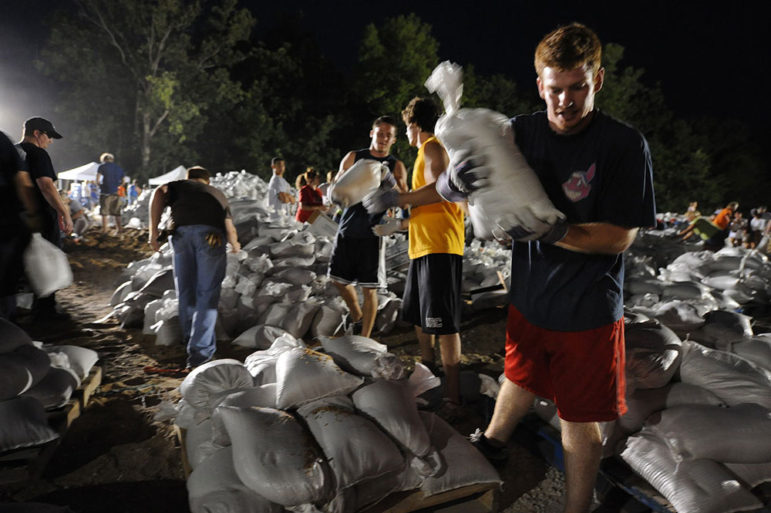
Every year, millions of Americans—on college campuses, through religious congregations, at schools, and in social service organizations—are participating in a wide range of volunteer activities. Whether teaching and mentoring children, helping seniors to live independently, or aiding families and individuals to recover from hurricanes and other disasters, volunteering is a way for people to help their neighbors and enhance their communities; it also provides opportunities for youth to develop valuable skills, adults to share their professional expertise, and older individuals to remain healthy by staying active and connected to their community.
But how has volunteering changed over the last forty years in the United States? Our research shows that volunteering has increased dramatically for certain age groups, particularly the oldest (sixty-five and over) and the youngest (sixteen to nineteen). Meanwhile, some important volunteering patterns have never changed: for example, people ages thirty-five to forty-four tend to volunteer more than younger adults and older adults, because they tend to have stronger connections to their communities. Overall, the long-term trends we outline will disappoint those who expected that national crises such as 9/11 and the Great Recession would spark a new golden age of sustained high levels of volunteering.
Background: Historical Data on Volunteering
In 2006, we (the authors of this article, along with our coauthors) published a research brief, Volunteer Growth in America: A Review of Trends Since 1974, while working for the Corporation for National and Community Service (CNCS). This brief presented a historical review of volunteering through an analysis of data collected in 1974, 1989, and 2003 to 2005 via the Current Population Survey (CPS).1 The CPS, conducted by the U.S. Census Bureau for the Bureau of Labor Statistics, is the source of official government statistics on employment and unemployment. Each month for over fifty years, the CPS has collected data from around one hundred thousand adults in approximately fifty-six thousand households across the United States. (See the Methodological Note on Survey Comparisons sidebar at the end of this article for more details about the historical CPS data.)
Each September since 2002, the CPS monthly survey has included a supplemental survey on volunteering, sponsored by CNCS. These supplements have provided researchers with annual data on volunteering that have served as the data source for several CNCS research reports.2 Most volunteering research in the United States has relied on the data from these individual, annual “modern-day” supplements;3 our approach offers a broader historical view by including data not just from the 2002 to 2015 supplement but also earlier supplements (1974 and 1989), in order to track historical changes in volunteering.
In our 2006 brief, we included CPS survey data from 1974 and 1989. Now, we add data from CPS’s 2015 supplement, so that we can take an in-depth look at volunteering during four different periods in American history.
Volunteering Hit a Forty-Year High After 9/11 and Then Declined Substantially
When the terrorist attacks of September 11, 2001, occurred, many observers speculated that the nation was entering one of those historical moments that would serve as a catalyst for a new age of citizen engagement. Prior to 9/11, substantial research found that individuals’ involvement with their community had significantly declined over the last half-century.4 Shortly after that, signs began to emerge that volunteering and other forms of civic participation in America were beginning to undergo a renewal. And this has been borne out: Americans’ engagement in politics, for one noteworthy example, has been increasing—with voter participation in presidential elections rising between 1996 and 2012, and peaking in 2008.5
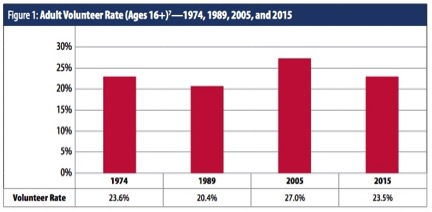
The immediate post-9/11 years were a high-water mark for volunteering, too—as Figure 1, which looks at volunteer rates across a forty-year period, demonstrates. When volunteer rates are calculated in a time-consistent way, the adult volunteer rate measured in September 2015 was virtually identical to the volunteer rate measured in April 1974. This is mainly a consequence of recent declines in the national volunteer rate: the 2015 rate is the lowest rate measured since the CPS began conducting annual volunteer surveys in 2002.6 Still, over sixty-two million adults reported in 2015 that they did at least some volunteer work over the previous year.
It appears that 9/11 had a relatively short-lived impact on volunteer rates on a national level. The decline is disappointing given our hope that 9/11 might help reverse long-term declines in community engagement. The decline is also surprising given that one would expect there to have been an increased demand for volunteers from nonprofit organizations: the Urban Institute’s National Center for Charitable Statistics estimates that between 2003 and 2013, the number of public charities increased by almost twenty percent.8 While many of these new nonprofits may be primarily staffed by professionals, nonprofit organizations continue to rely on volunteers to help them run their internal operations and provide services to the community (a national study of nonprofit volunteer management in 2003 indicated that 81 percent of nonprofit organizations in America use volunteers). The Great Recession, which started in 2007, didn’t stimulate any lasting outpouring of new volunteering by Americans—nor greater recruitment of volunteers by nonprofits, either—as Figure 1 suggests.
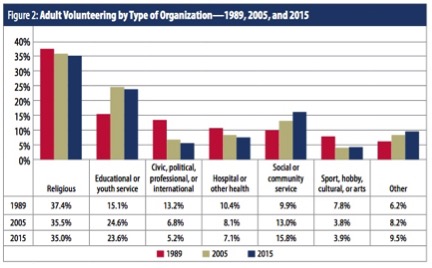
While the volunteering rate has risen and fallen over the last forty years, Americans have consistently volunteered more with some types of organizations than with others. Figure 2 shows the places where Americans spend the most time volunteering and how these patterns have changed since 1989 (the first time that the CPS supplement collected data on the main organization of volunteers). In all three time periods (1989, 2005, and 2015), religious organizations have been the most commonly reported main volunteer organization type. Meanwhile, civic, political, professional, or international organizations, sport, hobby, cultural, or art organizations, and hospital or other health organizations continued to lose market share in the volunteer workforce, while the percentage of volunteers who served primarily with education or youth services and with social and community service organizations continued to increase. In the “Other” category, historically less popular main-organization types (such as environmental, animal care, and public safety organizations) continued to grow in popularity between 2005 and 2015.
Volunteering among Teenagers (Ages Sixteen to Nineteen) Has Dramatically Increased in the Last Twenty-Five Years
The most striking change since the late 1980s is the dramatic increase in volunteering related to educational and youth services organizations, as Figure 2 shows. This trend parallels one of the biggest changes over the last forty years: a rising volunteer rate among teenagers.
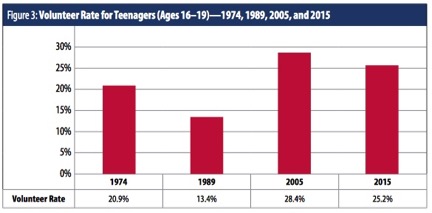
As Figure 3 shows, the volunteer rates of teenagers (ages sixteen to nineteen) were quite low in 1974 and 1989 but more than doubled between 1989 and 2005—to a rate that exceeds the national volunteer rate (27.0 percent in 2005). The 2015 teenage volunteer rate of 25.2 percent is still larger today than it was in 1974 and 1989, though the rate has declined since 2005.
What exactly is driving young people’s increased engagement in volunteering? One factor seems to be the growth of school-based service efforts (outside and inside the classroom). We conducted a national survey of school principals in 2008 that found that 86 percent of high schools organized community service opportunities. This compares to only 27 percent of public high schools in 1984, an indication that America’s schools have placed substantially more emphasis on engaging youth in service.9
A number of other long-term studies of youth corroborate our findings by reporting all-time highs in youth civic attitudes and behaviors over the last two decades. The Higher Education Research Institute’s (HERI) 2015 CIRP Freshman Survey found an all-time high in the percentage of first-year college students who said that helping others in difficulty was a “very important” or “essential” personal objective.10 The University of Michigan’s “Monitoring the Future” study also finds that volunteering among tenth and twelfth graders has risen steadily over the past fifteen years.11
Along with a high level of volunteering, young adults are increasingly likely to discuss politics—reversing the downward trend in political engagement since 1994.12 This interest in political events is matched by increases in the voting rate among young adults in recent years, with turnout among voters ages eighteen to twenty-nine peaking at 51 percent in the 2008 presidential election.13 As reported by UCLA Newsroom, the survey found that “interest in political and civic engagement [among entering college students] has reached the highest levels since the study began 50 years ago.”14 We are witnessing a historic group of highly motivated young people. It is even possible that 9/11 and the Great Recession did have a particularly profound, positive civic impact on some Americans who were coming of age during those periods.
Sign up for our free newsletters
Subscribe to NPQ's newsletters to have our top stories delivered directly to your inbox.
By signing up, you agree to our privacy policy and terms of use, and to receive messages from NPQ and our partners.
For Over Forty Years, the Life Cycle of Volunteering Has Remained Largely Consistent
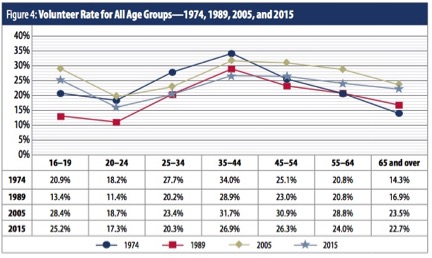
In every time period, the CPS supplement shows that teenagers volunteer at higher rates on average than young adults ages twenty to twenty-four. Figure 4 illustrates the life cycle of volunteering. In all four decades, the results show that volunteer rates tend to rise after age twenty, reach their highest point at ages thirty-five to forty-four, and then begin to decline. The rise in volunteer rates at midlife can be attributed to adults settling into their community, building and strengthening their social networks and career, and interacting with more community institutions after having children. The decline in volunteer rates tends to be associated with retirement, diminished physical capabilities, and loss of connections with established social networks. Over the last two decades, however, the decline in volunteer rates after ages thirty-five to forty-four has been less sharp, suggesting that the peak volunteering period now includes a slightly older age group.
Today, the volunteer rates of individuals ages thirty-five to forty-four and forty-five to fifty-four are largely the same. Delays in marriage and childbearing among many adults are likely two of the driving forces behind these trends. The presence of children under the age of eighteen is an important predictor of volunteering, due partly to the demand for parents to serve in organizations related to their children’s educational and social involvement. Between 1989 and 2015, the rate of adults ages forty-five to sixty-four with children younger than eighteen years of age in their household increased significantly from 19.1 percent in 1989 to 21.6 percent in 2015.15 Over this same time period, volunteers in this age group are more than twice as likely to serve primarily with educational and youth service organizations. These trends support the contention that adults ages forty-five to sixty-four are more likely than ever to engage with their communities through the activities of their school-age children.
Older Adult Volunteering Has Surged in the Last Forty Years
One of the most notable changes in volunteering over the last forty years came from adults ages sixty-five and over. As Figure 5 shows, the volunteer rate for these older Americans increased by 64 percent between 1974 and 2005 (from 14.3 percent in 1974 to 23.5 percent in 2005) and hardly changed at all between 2005 and 2015. Although the national volunteer rate for all adults declined substantially between 2005 and 2015 (from 27.0 percent in 2005 to 23.5 percent in 2015), the volunteer rate for older adults has dropped by less than a percentage point—the smallest decline of any age group.
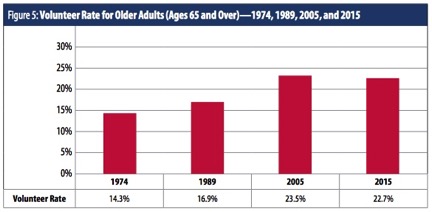
In recent years, the older adult volunteer rate has been growing closer to the rate for midlife adults. The drop-off in volunteer rates between adults in midlife and older adults—which is a standard feature of the life-cycle pattern of volunteer rates—seems to be shrinking in size (see Figure 4). The difference in volunteer rates was over five percentage points in 2005 but had decreased to 1.3 percentage points by 2015. This trend points toward today’s sixty-five-and-over age group being more likely to stay strongly engaged with volunteering than earlier generations.
Why has the volunteering rate increased so much among people ages sixty-five and over? While life expectancy in America has increased substantially since 1970, the position that older Americans are healthier today than they ever have been is more difficult to establish with certitude. In 2002, we found that poor health was the most common reason that older Americans did not volunteer. Yet, research also suggests that regular volunteering improves physical and mental health and may even lengthen life expectancy—especially if people develop the habit of volunteer service when they are younger.16 As researcher John Wilson notes, “Good health is preserved by volunteering; it keeps healthy volunteers healthy”—and this may be particularly true for seniors, who are most likely to experience significant health improvements from such activities.17
Demographic evidence also suggests that today’s older adults have more resources to bring to volunteering than their predecessors. The proportion of adults ages sixty-five and older without a high school diploma has dropped more than fifty percentage points since 1974, and older Americans with college degrees are also volunteering at a higher rate than in the past.18 Shifts in education levels and wealth among older Americans may have also led to increased recruitment by nonprofits as they recognized the rising potential of older volunteers. Volunteering may also be higher among older adults because more of them are staying in the workforce, whether out of financial necessity or personal desire. Labor force participation rates for adults ages sixty five and over have increased sharply in the last ten years, from 14.3 percent in 2005 to 18.4 percent in 2015.19 Older adults who continue to work are more likely to retain strong social networks and to be exposed and invited to more volunteer opportunities.
…
In Volunteer Growth in America, the 2006 report discussed earlier, we concluded that “…over the last 30 years…there has been a real increase in volunteering since 1974.” Ten years later, the U.S. volunteer rate has declined significantly, and today’s volunteer rate is not very different from that of 1974. The post-9/11 volunteer rates, which were the highest rates ever recorded, have steadily declined, especially over the past few years. Nonetheless, there is a real opportunity for nonprofits and other organizations to invest in approaches that capitalize on the wave of historically high volunteering going on today among teenagers and older adults.
The authors thank the original coauthors of the 2006 report—John Foster-Bey, David Reingold, and Becky Nesbit—as well as all of their former colleagues acknowledged in that brief. The original report is available here.
Methodological Note on Survey Comparisons
Each year since 2002, the Current Population Survey’s (CPS) September monthly edition has included a supplemental survey on volunteering, administered by the U.S. Census Bureau and sponsored by the Corporation for National and Community Service (CNCS). While many of CNCS’s volunteering research reports have relied on data from the modern-day (2002–2015) CPS supplements, both our 2006 report Volunteer Growth in America and this article offer a broader historical view of American volunteering by using data from two earlier CPS volunteer supplements, conducted in April 1974 and May 1989.
In order to arrive at definitions and measurements of key concepts that are consistent across all surveys, researchers must harmonize the data. For the 2006 report, we needed to develop a consistent definition of an “adult volunteer” that would allow us to compare volunteer statistics across survey periods. In all four survey periods, adult volunteers are defined as people ages sixteen or older who did work through an organization in the previous twelve months for which they were not paid.
The April 1974 survey collected volunteering data from respondents ages fourteen and older. To make the definition of adult consistent with present-day use, we excluded respondents ages fourteen and fifteen from our analysis, which causes the volunteer rate to differ from the results previously published from the 1974 survey. The results from the 1989 survey match the ones reported in previously published research by the Bureau of Labor Statistics (BLS), which also uses the sixteen-and-over definition. The 2005 results use this CPS definition of adult, too, but the results we reported were generated from a pooled CPS dataset that combines responses from the 2003, 2004, and 2005 volunteer surveys. For this reason, the 2005 results will differ from some previously published BLS data.
To create a fair historical comparison, we modified the calculation of the 2005 and 2015 volunteer rate so that it differs from the rate used in most previous reports. For this article, we used responses to the initial volunteer prompt on the CPS survey instrument (“Since September 1st of last year, [have you] done any volunteer activities through or for an organization?”) to calculate the 2005 volunteer rate. This calculation excludes a relatively small number of responses to the second volunteer prompt (“Sometimes people don’t think of activities they do infrequently or activities they do for children’s schools or youth organizations as volunteer activities. Since September last year, [have you] done any of these types of volunteer activities?”). Since the Census surveys of 1989 and 1974 did not include a follow-up question, we excluded those respondents who responded positively to the second prompt in 2005, in order to prevent an overinflation of the volunteering rate in 2005.
To update the volunteer trends we originally reported in the 2006 brief, we used the same formula to calculate volunteer statistics for 2015. Because of this change, the volunteer results we discuss in this article will differ slightly from numbers previously reported—especially those published in the annual U.S. Department of Labor Bureau of Labor Statistics brief, “Volunteering in the United States.”
Notes
- We analyzed CPS data from 1974, 1989, and 2005. The 2005 data are an aggregate of data from 2003 to 2005, and from this point on, these aggregate data will be referred to as 2005 data. The data collected in September 2002 include volunteering activities performed between September 2001 to September 2002, thus capturing volunteering that occurred in the year immediately after the September 11 attacks. The 2003 to 2005 data reflect the eventual rise in post-9/11 volunteering rates; however, the 2005 results do not include many of the volunteering activities that might have occurred following Hurricane Katrina, which hit the Gulf Coast at the end of August 2005. The 1989 and 2003 to 2005 surveys asked individuals not only if they volunteer but also where they volunteer, how they volunteer, and how often they volunteer. The 1974 survey did ask some volunteers where they volunteer and how often—but only about volunteering they did during the week the survey was administered.
- The Volunteering in America series includes: Volunteering in America: State Trends and Rankings (2006), which is the first report with detailed information about adult volunteering by state; College Students Helping America (2006), which identifies trends in college student volunteering; and the Youth Helping America series (2005–2008), which analyzes teenager volunteering through school and school-based service-learning projects, religious congregations, and community associations, as well as volunteering experiences with their family.
- CPS supplements after 1989 are referred to as “modern day” supplements to differentiate them from the earlier surveys, which were conducted on an irregular basis and with no attempt at using standard definitions or wording of questions.
- Robert D. Putnam, Bowling Alone: The Collapse and Revival of American Community (New York: Simon and Schuster, 2000).
- “Voter Turnout in Presidential Elections: 1828–2012,” The American Presidency Project website, accessed August 12, 2016.
- The decline in volunteer rates between 1974 and 1989 could be due to many factors, including (but not limited to) changes in population demographics, national socioeconomic trends, and the increase in demand for volunteers among nonprofit organizations. For additional details about the 1974, 1989, and “modern-day” CPS supplements, and how the data were used for this analysis, please see the Methodological Note on Survey Comparisons sidebar at the end of this article, or visit this site for more information.
- We follow the Bureau of Labor Statistics convention of designating everyone ages 16 and older “adults,” because that’s when they can enter the workforce without parental consent.
- Brice S. McKeever, The Nonprofit Sector in Brief 2015: Public Charities, Giving, and Volunteering, (Washington, DC: Urban Institute, October 2015).
- Kimberly Spring, Robert T. Grimm, Jr., and Nathan Dietz, Community Service and Service-Learning in America’s Schools (Washington, DC: Corporation for National and Community Service, Office of Research and Policy Development, November 2008); and Robert T. Grimm, Jr. et al., Building Active Citizens: The Role of Social Institutions in Teen Volunteering (Washington, DC: Corporation for National and Community Service, Office of Research and Policy Development, November 2005).
- Kevin Eagan et al., The American Freshman: National Norms Fall 2015 (Los Angeles: Cooperative Institutional Research Program at The Higher Education Research Institute, University of California, 2015).
- The rate for eighth graders has declined over the past five years, but it rose steadily over the ten years before that. See “Monitoring the Future” study results in Volunteering: Indicators on Children and Youth, Child Trends Data Bank, December 2015.
- Eagan et al., The American Freshman.
- CIRCLE Staff, “The Youth Vote in 2012,” CIRCLE Fact Sheet, May 2013, Center for Information & Research on Civic Learning & Engagement, May 10, 2013.
- “College students’ commitment to activism, political and civic engagement reach all-time highs: In study by UCLA’s Higher Education Research Institute, highest percentage ever of incoming students say they’d likely participate in protests,” UCLA Newsroom, February 10, 2016.
- Authors’ calculations are from 1989 and 2015 CPS data.
- Doug Oman, Carl E. Thoreson, and Kay McMahon, “Volunteerism and Mortality among the Community-dwelling Elderly,” Journal of Health Psychology 4, no. 3 (1999): 301–16; Marc A. Musick and John Wilson, “Volunteering and depression: the role of psychological and social resources in different age groups,” Social Science & Medicine 56, no. 2 (January 2003): 259–69; Judith A. Wheeler, Kevin M. Gorey, and Bernard Greenblatt, “The Beneficial Effects of Volunteering for Older Volunteers and the People They Serve: A Meta-Analysis,” International Journal of Aging and Human Development 47, no. 1 (July 1998): 69–79; Richard G. Rogers, “The Effects of Family Composition, Health, and Social Support Linkages on Mortality,” Journal of Health and Social Behavior 37, no. 4 (December 1996): 326–38; and Marc A. Musick, A. Regula Herzog, and James S. House, “Volunteering and Mortality Among Older Adults: Findings From a National Sample,” The Journals of Gerontology 54B, no. 3 (1999): S173–S180.
- John Wilson, “Volunteering,” Annual Review of Sociology 26 (2000): 215–40.
- Ibid.
- Authors’ calculations are from 2005 and 2015 CPS data.