New Developments
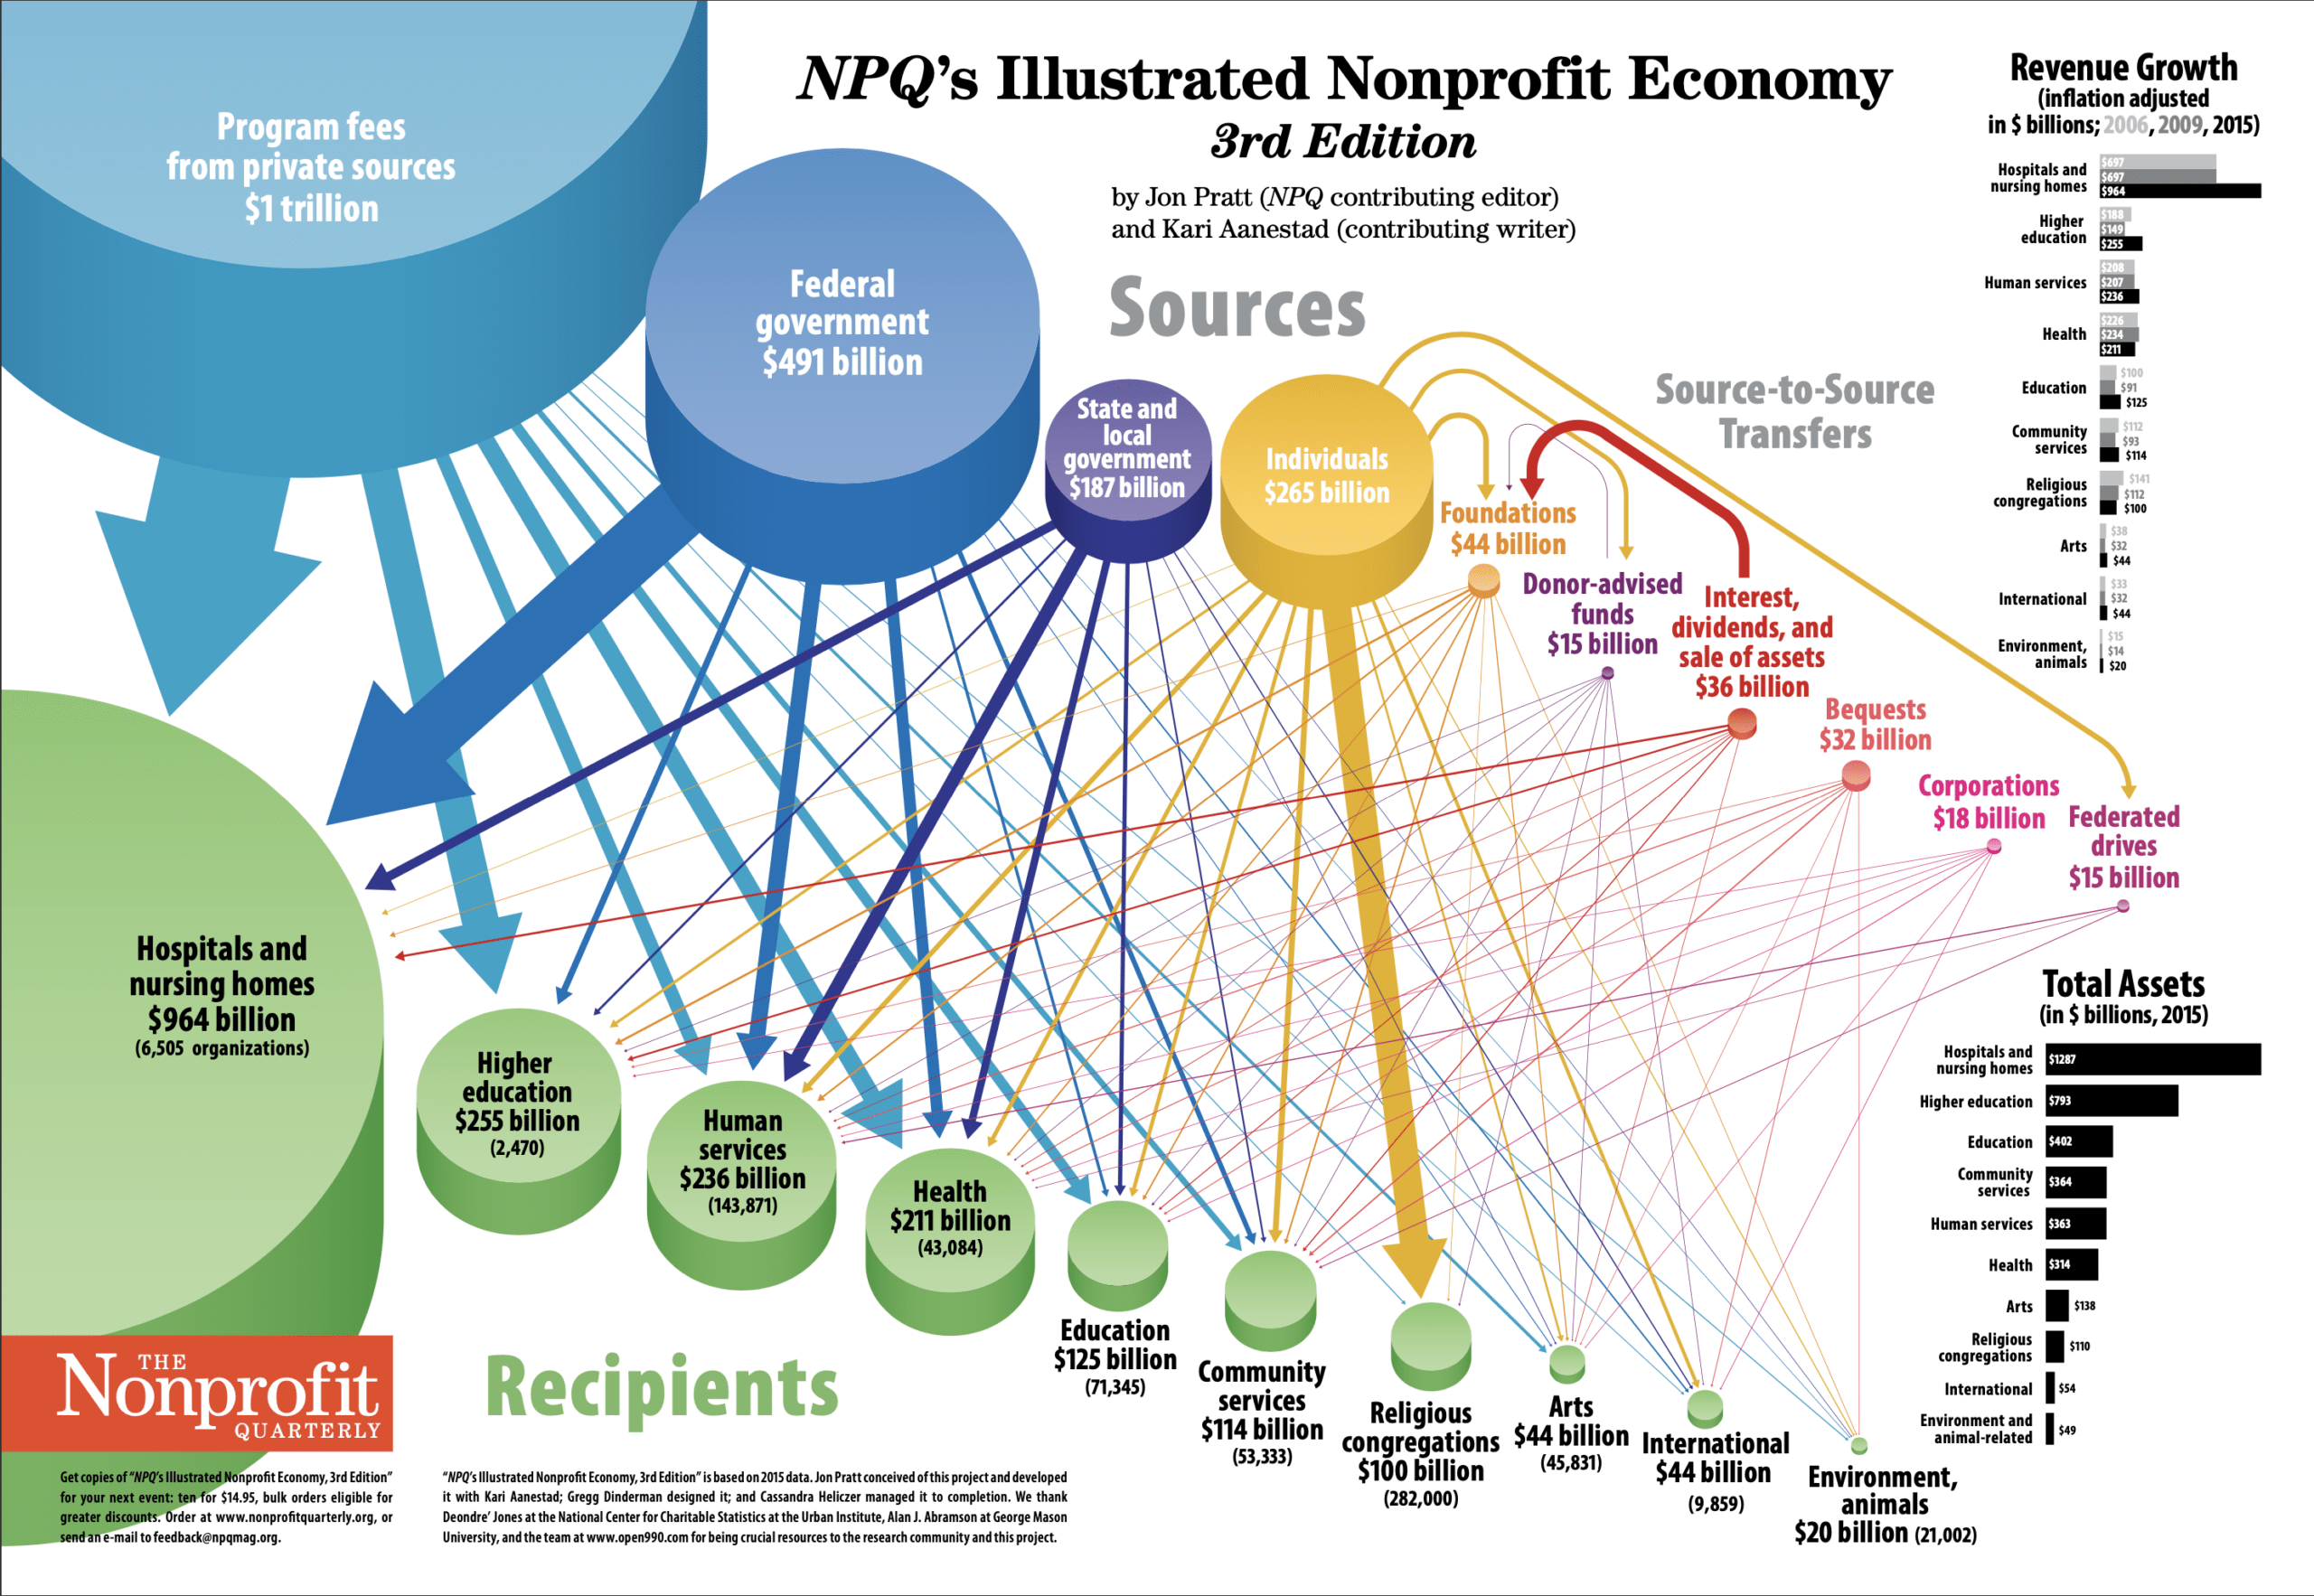
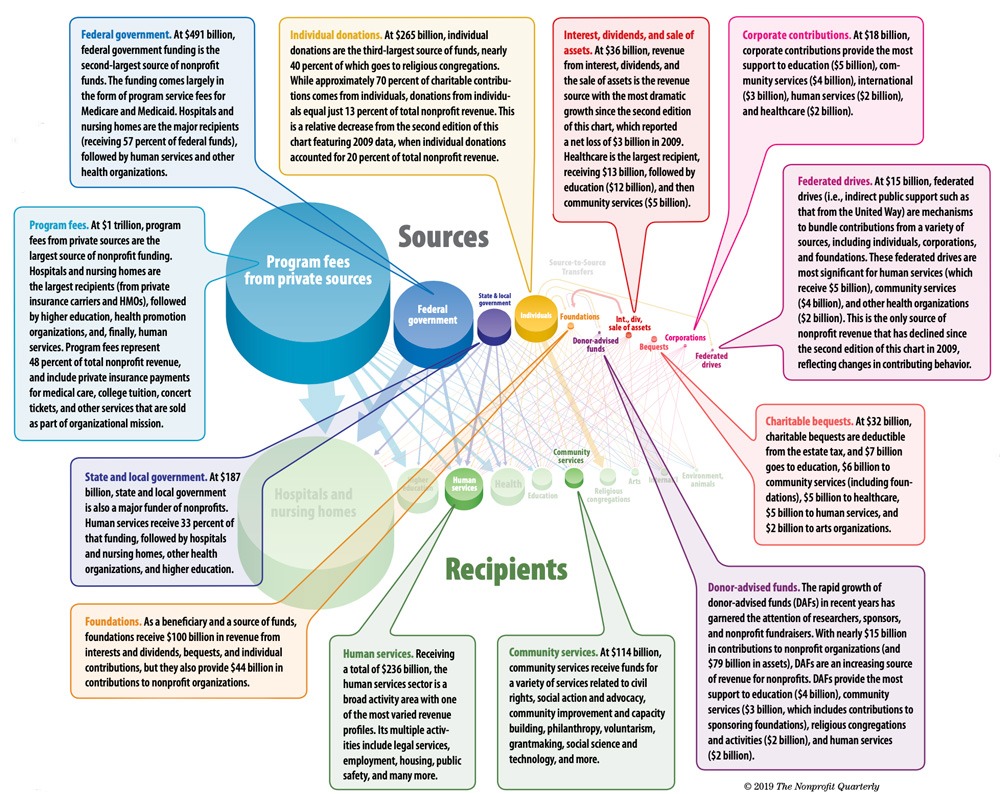
When comparing the third edition of this chart to the previous two, a few themes are worth highlighting. There is continued dominance of health organizations, earned income from program fees, and federal funding. Revenue from interest, dividends, and sale of assets has shot up following a rebound in the economy (with a reported net loss of $3 billion in 2009 but $36 billion in revenue in 2015). Charitable giving from federated drives was the only source of nonprofit revenue to decline, shrinking from $22 billion in 2009 to $15 billion in 2015. And the tremendous growth of donor-advised funds (DAFs) warrants a separate portrayal as a source of nonprofit revenue.
How to Read the Chart
The chart features the ten major sources of revenue for US nonprofits (top row), the ten major activity areas of charitable organizations (bottom row), and pipelines indicating the relative amount of money flowing from each source to each activity area. The chart was developed using 2015 data from the National Center for Charitable Statistics—a program of the Center on Nonprofits and Philanthropy at the Urban Institute—as well as Internal Revenue Service data from individual tax returns and nonprofit Form 990 and 990-PF filings by 501(c)(3) public charities and private foundations. The chart was categorized using the national taxonomy of tax-exempt entities (publicly accessible data sets available at nccs-data.urban.org and www.open990.com).
Revealing the size and diversity of the nonprofit economy, “NPQ’s Illustrated Nonprofit Economy, 3rd Edition” depicts the various flows into the nonprofit sector, with more than 679,000 U.S. nonprofits, $2 trillion in revenue, 12 million employees,1 and 63 million volunteers.2
The width of each pipeline is proportionate to the dollar amount of the revenue stream (streams of $1 billion or less are not shown). The emerging picture is a complex set of revenue sources, with variations depending on activity area.
Sign up for our free newsletters
Subscribe to NPQ's newsletters to have our top stories delivered directly to your inbox.
By signing up, you agree to our privacy policy and terms of use, and to receive messages from NPQ and our partners.
Each funding source—individuals, investments, government, fees for service, et cetera—has inherent characteristics, with distinct acquisition costs and conditions for recipients. (Often, the funding sources with the fewest conditions are the most expensive to acquire—such as individual small donations—while federal funding is free to submit but arduous to receive.) A central issue not depicted in the chart is each revenue source’s downstream effect on organizations—let alone the cumulative effect of multiple (and sometimes contradictory) sources of funding.
For many nonprofit managers, this complexity is a defining fact of life—particularly for nonreligious activity areas that generate less revenue than do hospitals and nursing homes and colleges and universities. Organizations active in health, human, or community services frequently face convoluted combinations of funding sources—each with its own set of transaction costs, qualifications, timeline, politics, and so on. Making matters worse is the fact that many revenue sources impose unwieldy restrictions that make compliance a tightrope act.
We round out the landscape with two additional views of the ten activity areas: total assets and ten-year revenue growth, which generally mirror the distribution of annual resources, as illustrated in the chart.
Notes
- Bureau of Labor Statistics, nonprofit employment of 501(c)(3) organizations in 2015. Data were mostly taken from Urban Institute’s National Center for Charitable Statistics (NCCS) 2015 Form 990 PC core files (file “nccs.core2015pc.csv” is available at nccs-data.urban.org/data.php?ds=core). The total number of nonprofit organizations reported in this chart is slightly higher than the NCCS data set, because the authors adjusted the numbers to include religious congregations based on estimates from the American Church List.
- Brice S. McKeever, The Nonprofit Sector in Brief 2015: Public Charities, Giving, and Volunteering (Washington, DC: Urban Institute’s National Center for Charitable Statistics [NCCS], 2015).