Editors’ Note: This article is based on a research paper, “Funding: Patterns and Guideposts in the Nonprofit Sector,” which explores funding patterns among large, financially sustainable nonprofits across several domains and among organizations of various sizes engaged in youth services and environmental advocacy. The full study is available from Bridgespan.
Funding is a constant and pressing concern for nonprofit organizations across the United States. It is surprising, therefore, how little information exists about patterns in funding at a level below that of broad domains (such as youth services) or the sector overall. Such information could be of enormous use to both practitioners and funders, because it could provide guidance about what tends to happen in the financing of specific types of nonprofits and the consequences of those tendencies.
Lacking such pattern-level information, funders and nonprofit leaders have little choice but to make assumptions—like “diversification of funding sources (e.g., individual, government) makes for a healthier organization.” As with much common knowledge, this assumption may be true to some extent but incomplete. Better identification of patterns among similar organizations could both test such assumptions and provide important guideposts for nonprofits that want to build robust economic models.
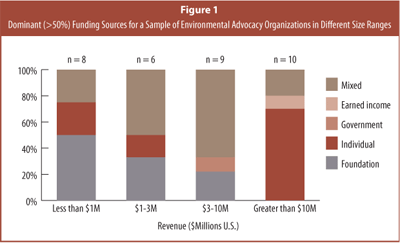
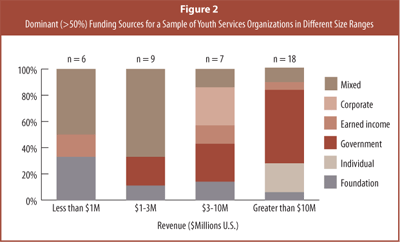
To that end, in 2003, the Bridgespan Group studied the patterns of funding sources in two specific sub-sectors. We looked at a small number of organizations in youth services and environmental advocacy. Using Form 990 returns complemented by organization-specific reports and personal interviews, we found clear differences in the typical funding mix of organizations depending upon their size. We also identified a distinct pattern that can be described as a “U-shaped curve,” characterized by fewer funding sources at the smallest and largest ends of the spectrum and a greater mix in the middle for midsized organizations (see figures 1 and 2).


A broader study might reveal a different picture. Nonetheless, our efforts point to some potentially generalizable patterns that need to be further tested and explored.
Pattern Hypothesis #1: The U-shaped curve exists and is generalizable across sub-sectors of nonprofits.
Pattern Hypothesis #2: Organizations hit distinct “funding walls” at the key transition points along the U-shaped curve.
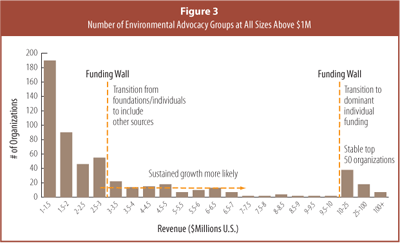
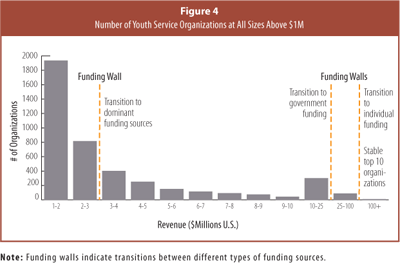
The funding mixes for organizations in these two domains appear to change at distinct size points, which correlate with marked drop-offs in the absolute number of organizations. If it is true that different economic models support different-sized organizations, then nonprofit leaders must be able either to recognize the need for change and adapt, or to understand that beyond certain points growth is unlikely.
For youth services organizations, diversification in funding sources appears to increase until about the $3 million mark, at which point we observe a transition to more concentrated funding sources. For environmental groups, $3 million in revenue is the point where organizations transition away from foundation funding and to their most diverse funding sources. Our data then suggest that environmental organizations transition back to concentrated funding (individual) at $10 million. If these walls do occur at predictable points in each sub-domain,they could signal when a transformation is necessary (see figures 3 and 4).


Pattern Hypothesis #3: The U-shaped curve reflects organizational learning at work.
If this hypothesis is true, nonprofits do not necessarily start with an economic model that remains constant throughout their lives; but rather a “set-point” model evolves over time. This “evolutionary” view creates an important role for experimentation (hopefully complemented by data on other organizations) and suggests that a diversity of funding sources is an important interim stage for organizations that aspire to grow large.
Taking this view, diversified funding might become a poor strategy for larger organizations over the long haul for a host of reasons. These include: transactional costs, or the administrative and fundraising expenses incurred by maintaining a variety of resource identification and reporting systems; the inability to become truly expert or “world class” at more than one source; and/or the simple lack of large-scale funding interest from multiple sources for organizations with particular kinds of missions.
Sign up for our free newsletters
Subscribe to NPQ's newsletters to have our top stories delivered directly to your inbox.
By signing up, you agree to our privacy policy and terms of use, and to receive messages from NPQ and our partners.
Interpreted this way, the data suggest a natural learning curve that leads, in the case of larger organizations, to the identification and predominance of the few best funding sources relative to domain and particular need.
Pattern Hypothesis #4: Some funding sources take you farther than others.
Alternatively, these findings could suggest that successful growth may require concentrating on certain types of funding sources from early on—the growth “winners” had different economic models than their peers. If this second interpretation is correct, organizations either need to lay the groundwork early on to attract those kinds of funds or recognize that large-scale expansion will probably not be the way their nonprofit achieves impact.
Funding types are not equal, of course, either in transaction costs or in payoff. Our data suggest that the particular mix of funding in an organization varies by domain (e.g., larger environmental advocacy groups are supported primarily by individuals, and larger youth service organizations are supported primarily by government). However, the very largest organizations in both sub-sectors were supported by individuals.
This raises important questions about which individuals are driving such large-scale expansion. Is it thousands of small donors or dozens of very large donors? What is the role of the brand, and how do volunteers factor in? How do the very largest nonprofits in some sub-sectors succeed with individual donations while, overall, the sub-sector does not?
We hope that better knowledge about funding patterns in the nonprofit sector will benefit foundations and other funders looking to maximize the impact of their charitable donations.
For example, the findings in this study highlight that foundation contributions decline as a percentage of total funding in larger organizations and are not the dominant source of funds for large organizations. As a result, one could argue that foundations play a more pivotal role in the lives of small and mid-sized organizations. At the same time, the absolute amount of foundation funding for large organizations is still considerable. Nothing in our findings suggests that this is a bad thing, but it does beg an important question: Should foundation leaders think differently about grants to nonprofits of different sizes, particularly when they are considering investments in capacity-building versus program-specific resources?
For large nonprofits, limiting funding to direct program services would seem to foster only a small amount of growth on top of what other sources are already covering. Would it be sensible, therefore, for a foundation to value more highly the opportunity to provide scarce capacity-building or unrestricted funding to their large grantees?
For small organizations, foundation dollars may pay for a great deal of the actual program work. If the foundation is committed over a long time frame, this can be quite a stable situation. But what about the growth of such small organizations? If growth is an objective, can foundations play a critical role in helping these nonprofits grow by providing capacity dollars to identify and build their funding models around other sources (e.g., government, individual, etc.)?
As mentioned earlier, expanding the sample sizes and sub-sectors covered in this research could be a useful approach in providing more reliable guideposts for nonprofit organizations and funders. At this point, our efforts indicate that youth services and environmental advocacy organizations follow a “U-shaped curve,” with the smallest and largest organizations relying on fewer funding sources, and mid-sized organizations using a greater mix. Our research also suggests the presence of distinct funding “walls” and indicates that predominant sources for support are identifiable for each sub-sector.
We are curious to hear from other organizations whether this curve fits their experience; we would also like to collect stories from those that have been able to achieve significant growth to gain more generalizable insights into building effective economic models and fund development strategies.


