

This article, drawn from a new Bridgespan Group report, looks at one way national nonprofit networks (defined as associations or affiliate or membership organizations, with multiple sites and a common brand) are optimizing each individual site’s capacity to attract its share of local donated dollars. (Click here to access the report.) The article is from the Nonprofit Quarterly’s spring 2016 edition, “Strategic Nonprofit Management: Frameworks and Scaffolding.”
While it is common for large nonprofit networks such as the YMCA or The Salvation Army to compare costs and revenues across sites, few have attempted to ask which sites are doing the best job of maximizing fundraising potential—what we call fundraising effectiveness. In other words, is Site A not only raising more money than Site B, but also capturing more of the available donor dollars for its cause in its community than Site B? That kind of comparative analysis can be used to help networks and individual sites learn and adapt best fundraising practices from top performers.
For at least twenty-five years, the corporate world has used an analysis called share of wallet to measure the proportion of customers’ total spending that a business captures in the products and services it offers.1 “It’s very common in our work,” explained Dianne Ledingham, a leader of Bain & Company’s Customer Strategy & Marketing practice area. “Any time we work with a multisite or multiproduct organization, we do a share-of-wallet analysis—which is really just share of market.” It’s an analytical tool that nonprofits can adapt to enhance their fundraising effectiveness.
To date, only a few nonprofit networks have experience with share of wallet.2 The United Way, for example, which has a strong analytical tradition and something of a private sector mindset, already uses a form of share of wallet to analyze fundraising performance across its affiliates. But the concept appears to be catching on. The Bridgespan Group, for instance, recently worked with several nonprofit networks to adapt the tool, and many others are thinking about how to incorporate it into their fundraising efforts. Sondra Madison, national vice president for operations and collaborative strategy at Boys and Girls Clubs of America, noted, “This kind of analysis has come up in our conversations with clubs. We love the idea of this, and it wouldn’t be too laborious to implement.”
Nonprofit networks are drawn to share-of-wallet analysis because it can measure how much individual donors are giving to each network site as a share of total income in the community.3 The network can then compare that measure across sites. This allows for a ranking that takes into account community size and income, giving a truer comparison of how sites are doing at tapping into available resources in that community or service area.4 This kind of data makes it possible for networks to answer three key questions:
- Who are my top performers?
- How much variation is there between sites, and where does it occur?
- How much value is there in raising lower performers to at least the median?
Consider the example of The Salvation Army Empire State Division, with multiple full-service sites across Upstate New York, each of which raises some or most of its funds locally. The Division in recent years found itself facing a steep challenge in meeting the ever-growing needs of the communities it serves. (See Figure 1.)
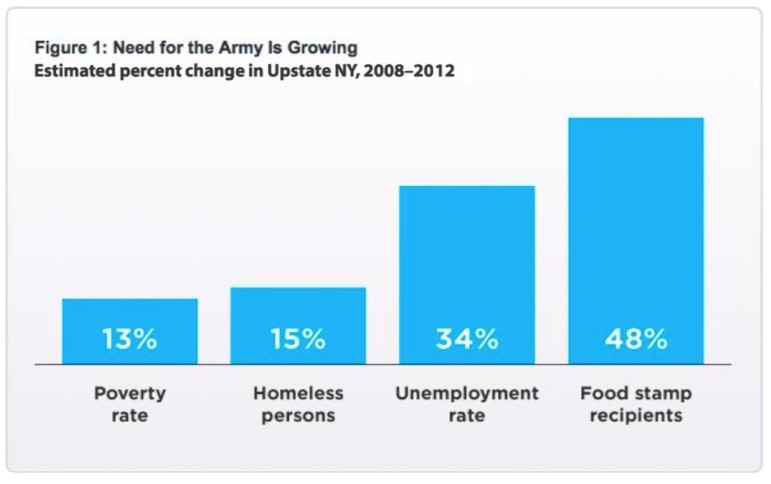
The Empire State Division in 2014 had forty-two full-service sites and, having worked hard to cut costs and improve efficiency, asked how it might improve fundraising performance. Donations from individuals were key. The sites get a significant portion of their fundraising dollars this way, including not only the ten- and twenty-dollar bills that passersby stuff into The Salvation Army’s famous red kettles during the holidays, but also seasonal appeals by direct mail and major donor gifts from affluent supporters. The Division had data on the amount of money each site raised; it is no surprise that the biggest cities—Syracuse, Buffalo, and Rochester—raised the most, with budgets several times those of small communities like Oswego or Wellsville.5 But did raising the most mean they were top performers in tapping available local dollars and, as a result, are best-practice role models?
Applying Share-of-Wallet Analysis
To answer that question, the Division conducted a share-of-wallet analysis that focused on individual giving (which could also include events, if the revenue was mainly from individuals). It involved six steps.6
Step 1. Identify which categories to analyze within individual giving. The Empire State Division’s analysis followed its three distinct revenue streams from individuals: red kettles, seasonal mail appeals, and other donations. For other networks, revenue streams such as fundraising walks or other special events might be the right categories. Some networks may have only a single type of individual-based revenue worth analyzing. Use the categories that are most logical and most comparable across sites for your organization.
Step 2. Collect multiple years of fundraising data. Comparisons for a single year might be thrown off by an outlier, such as one really big gift. The Empire State Division used three years of fundraising data for each site—looking at results for each year, and then across all three years. It found that the top performers in a single year were usually the top performers in the other years as well, suggesting that those sites were using fundraising practices that worked over time.
Step 3. Segment sites into logical groupings. The essence of share-of-wallet analysis is that it allows sites to learn from their peers, so it may make sense to look at comparisons across the entire network and within categories of sites that share similar characteristics. Many networks already have categories in place, and such existing groupings may be the best place to start. The most logical grouping is by size, but for some networks, another form of segmentation (by type or region) might also be worthwhile. The Empire State Division divided its forty-two sites into five segments based on annual revenue. It then analyzed the data both within segments and across all forty-two sites. This allowed Division leaders for the first time to see not only that one small community outperformed another, but also that, in terms of share of wallet, some little communities outperformed the largest cities.
Step 4. Identify the site boundaries or service areas for which income will be calculated. The Empire State Division had already assigned every ZIP code in Upstate New York to their sites, making analysis easy. If it’s necessary to draw geographical boundaries specifically for the share-of-wallet analysis, be sure that each site’s boundaries incorporate the great majority of the people it serves and from whom it raises money.
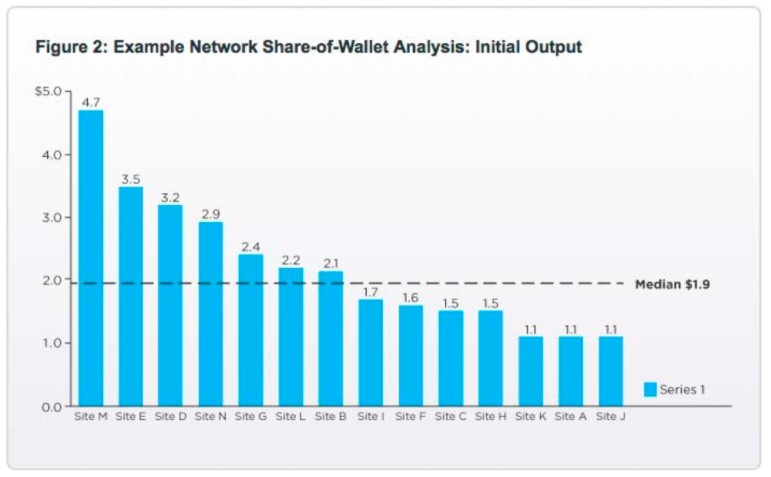
Step 5. Based on income, calculate share of wallet. For each funding category, share of wallet is simply fundraising yield as a share of the income within that site’s service area. Because the actual percentage is a very low number with a lot of zeros after the decimal point, it’s easier to omit the zeros and express share of wallet as a number greater than one. In Figure 2 this is expressed as dollars raised per $100,000 of community income. The chart depicts how a share-of-wallet analysis might look for a hypothetical group of fourteen sites within a network. While the chart does not use actual data from the Empire State Division’s analysis, the numbers reflect the kind of variation found.
Sign up for our free newsletters
Subscribe to NPQ's newsletters to have our top stories delivered directly to your inbox.
By signing up, you agree to our privacy policy and terms of use, and to receive messages from NPQ and our partners.
Step 6. Analyze the data. In examining the data from the share-of-wallet analysis, it is important to determine whether the findings merit taking action and what the action priorities should be, given that most networks don’t have the resources to focus on improving practices everywhere.
Carrying out the analysis proved to be an eye-opener for the Division. “[Before the analysis] we really didn’t look at fundraising potential, just at the current reality,” said Paul Cornell, the Division’s financial secretary. “I was surprised by what we found. Doing that analysis was revealing,” he added. More important, it answered the three key questions that any such analysis should address.
1. Who Are My Top Performers?
Several sites appeared to be performing much better than the median. In fact, a couple of the Division’s smaller sites emerged as the top performers on a share-of-wallet basis, beating out larger sites. In analyzing share-of-wallet results, it’s also important to incorporate information that might explain unexpected variations. In some instances, a particular event or circumstance—such as a funding spike in the wake of a natural disaster—may distort the findings for a site.
2. How Much Variation Is There, and Where Does It Occur?
In our hypothetical example (Figure 2, above) there is a lot of variation. The top-performing site raises a share of wallet more than four times greater than the lowest-performing site. Several sites raise a much greater share than the median, and several raise a much lower share. The amount of variation and where it occurs, combined with judgments about the greatest opportunities for improvement, will help you think about where to invest your time and effort. If the amount of variation is roughly equal across each of several fundraising categories, but one category raises far more than the others, you may want to focus first on that biggest revenue category. If there’s only slight variation in some areas but a lot in others, you may want to focus first on the areas with the most variation—and, presumably, the most opportunity for improvement among the lower-performing sites.
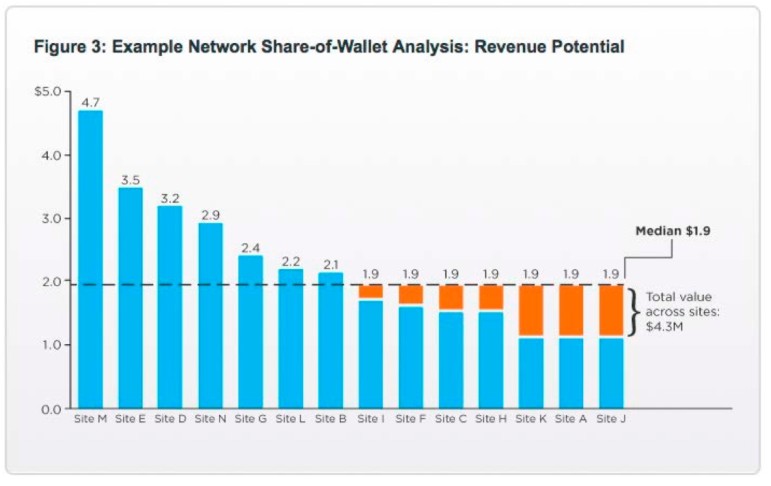
3. How Much Value Is There in Raising Lower Performers to the Median?
Continuing our hypothetical example, raising all the underperformers up to the median would bring in an additional $4.3 million. (Figure 3, below, shows this calculation in orange.) When the Empire State Division did this same calculation based on its share-of-wallet analysis, it found that getting all the lower performers up to the median could bring in an extra $2 million a year—a substantial amount of money for the Division. Raising everyone to the median shouldn’t necessarily turn into an organizational goal. What is the chance, after all, that all the below-average performers could improve? The purpose of this calculation is to help you to understand the scope of the potential gains and how much to invest in the effort.
Learning and Sharing Lessons from Top Performers
Finding your top performers is part of the battle, but the goal is understanding how they achieved their fundraising effectiveness and then sharing those lessons with other sites to boost lower performers. To get there, you need to identify which practices might be driving top performers.
Working with the Empire State Division and using the results of its share-of-wallet analysis, Bridgespan interviewed officers at the top-performing sites to identify fundraising practices that lower-performing sites might adapt. We synthesized what we heard, tested these findings both with divisional leaders and a range of site leaders, and identified what might be broadly applicable. For example, we heard about some very specific practices related to the red kettles: where volunteers were sent, and which shifts they took (late afternoons and evenings seemed to be especially productive). In addition, the higher-performing sites seemed to have a deeper understanding of funders, stakeholders, and partners in their community, so we developed a community assessment tool that every site could use to strengthen this understanding. And we listened carefully for what wasn’t working so well—for example, “We don’t have a good way to track and analyze our donors,” and “We need to think more strategically about donor price points.” Based on these identified gaps, we reached outside the network for tools—such as an approach to categorizing donors by giving level—that might address those needs.
How a network broadly shares what it has learned from a share-of-wallet analysis also depends on organizational culture and established methods of communication. Regardless of whether a network operates as a single entity—such as The Salvation Army—or a set of independent affiliates—such as the YMCA—sites themselves will need to be partners in a dissemination process that includes the following:
- Codify practices as concretely as possible. Give examples, adapt tools already in use by one or more sites, or create new ones reflecting best practices or identified needs. For the Empire State Division, the community assessment tool has gotten the greatest traction across the network. “It has really given the officers the opportunity to look at what is happening in their communities,” explained Peter Irwin, director of advancement. “It’s showing sites what the needs are, where the duplications are, and the strengths and weaknesses in their relationships with the community.”
- Have peers teach peers the promising practices. But carefully consider who is most likely to learn from whom. The reason for segmenting the share-of-wallet analysis by size or other criteria is so that sites can learn from others whom they consider their peers. As Lynn Hepburn, the chief development officer of Girls Inc., reminded us, “One major challenge in adopting best practices is that smaller sites can’t imagine doing the same things that larger sites do.”
- Keep the dissemination process going. Don’t stop learning and sharing, including the successes and challenges that emerge as sites seek to adopt some of the practices of the top performers.
The Empire State Division is spreading both the community assessment and donor categorization tools across its network. And the red kettles have been the centerpiece of the Division’s performance improvement effort. Division leaders were able to combine insights identified through the share-of-wallet process with a national tool called Kettle Manager, first used by the Empire State Division in 2013, just before its share-of-wallet analysis got under way. Indeed, a particular value of share-of-wallet analysis may be, as in the case of the red kettles, when insights from it connect with and reinforce other efforts already under way in the organization. In 2014, the Empire State Division’s improvement efforts helped it chalk up the largest gain in red kettle revenues that year of any of the forty Salvation Army USA divisions.
Seeing the fundraising results from the improved red kettle practices has been a huge driver of progress within the Empire State Division, said Irwin. “When officers start to see the results, it helps them understand that change is important.” Beyond giving funding a boost, the share-of-wallet analysis generated insights “about how we should focus our efforts and resources within the Division,” said Cornell. Indeed, share of wallet’s days as an analytical method used only by the private sector may soon pass, as more nonprofit networks embrace its power to strengthen their fundraising effectiveness.
Notes
- Lauryn Franzoni, “Client’s sales are poor gauge of profit potential for bank,” American Banker, July 3, 1991, 6.
- Nonprofit networks are uniquely able to do this because they have a sufficient number of sites to make comparisons useful and they have access to relevant data for all of those sites.
- We use income as a proxy for total giving because this data is much easier to gather and use.
- Share of wallet could potentially also be used to compare performance in other funding streams (such as corporate or foundation giving), though income would probably not be the best denominator, as it is for individual giving. Instead, one would use something like total corporate or foundation giving within a particular community or service area (unlike U.S. Census income data, this isn’t as readily available).
- Information taken from The Salvation Army Empire State Division internal financial data.
- See “Share-of-Wallet Analysis How-To Guide” and accompanying DIY analysis spreadsheet.
Mark McKeag is a manager and Andrew Flamang is a consultant at The Bridgespan Group. They are coauthors of The Bridgespan Group’s “Share-of-Wallet Analysis How-To Guide” and the report Helping Nonprofit Networks Strengthen Their Fundraising Effectiveness (Bridgespan.org, March 2016).