August 18, 2016; Washington Post
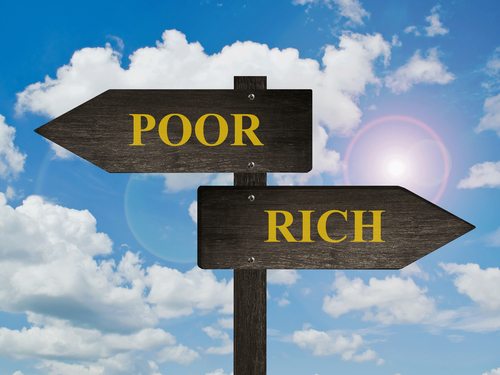
It’s not just stale political rhetoric: The divide between our nation’s rich and poor continues to grow. Wealth recovery from the depths of the 2007 Great Recession has been almost total for those with the most wealth and not at all for those with the least.
A new Congressional Budget Office report requested by Senator Bernie Sanders (I-VT) and released last week tracks family wealth between 1989 and 2013. The picture’s not reassuring.
The share of wealth held by families in the top 10 percent of the wealth distribution increased from 67 percent to 76 percent, whereas the share of wealth held by families in the bottom half of the distribution declined from 3 percent to 1 percent. The gap between wealth held by families at the 90th percentile and the wealth of those in the middle widened from $532,000 to $861,000 over the period (in 2013 dollars).
Sign up for our free newsletters
Subscribe to NPQ's newsletters to have our top stories delivered directly to your inbox.
By signing up, you agree to our privacy policy and terms of use, and to receive messages from NPQ and our partners.
The CBO report describes an economy that rewards wealth and punishes poverty. Between 1989 and 2007, the average household in the top 10 percent of the population saw its net worth almost double, reaching $4.1 million. For the family on the economy’s middle rung, 2013 found them just treading water with the same $80,000 they owned in 1989. But for the average family in the bottom quartile, things have gone further downhill; they went from owing $1,000 in 1989 to having a debt of $13,000 in 2013.
Two pillars of wealth accumulation, home ownership and advanced education, also rewarded the wealthy and punished the poor. For those at the bottom, these have turned out to be fool’s gold. More than 50 percent of those with the least wealth who own homes find themselves underwater—owing more to a bank than their home is worth. That number was about 10 percent when the Great Recession began. Jim Tankersley, reporting for the Washington Post, observed that those families also borrowed heavily for education, noting that the CBO report says that over that period, “the share of families with student debt increased from 25 percent to 36 percent, and the average amount increased from $24,000 to $36,000.”
As the plight of the poor has worsened, the role of government as a vital safety net has weakened. Over this period, the number of people receiving cash assistance declined significantly as federal policy shifted from Aid to Dependent Families and Children (AFDC) to Temporary Assistance to Needy Families (TANF). According to the Center on Budget Policy and Priorities:
Over the last 20 years, the national TANF average monthly caseload has fallen by almost two-thirds—from 4.4 million families in 1996 to 1.6 million families in 2014—even as poverty and deep poverty have worsened. The number of families with children in poverty hit a low of 5.1 million in 2000, but has since risen to more than 7.1 million. Similarly, the number of families with children in deep poverty (with incomes below half of the poverty line) hit a low of about 1.9 million in 2000, but is now at about 3.1 million.
Policies that limit taxes on the wealthy (and still leave the top 1% of income earners paying almost half of all income taxes) and reduce government’s role in boosting the economy and providing a safety net for those who struggle have not worked to the benefit of the poor. Those who have the least must expect more from our leaders.—Martin Levine

