
This article, from the Nonprofit Quarterly’s fall 2016 edition, “The Nonprofit Workforce: Overcoming Obstacles,” comes to us from the Urban Institute’s National Center for Charitable Statistics. It kicks off a full month of NPQ’s focus on the nonprofit workforce. Much of the information in it has been drawn from the Urban Institute’s 2016 Nonprofit Almanac, which we have found to be a necessity for informed nonprofit leaders. Here’s the link to purchase the book.
The publisher, Rowman & Littlefield, is offering a 25% discount. Use code 4F16UIPBKS at checkout.
Nonprofit organizations, in addition to the important social roles they play, are powerful contributors to the economy. Most are public charities, classified under Internal Revenue Code section 501(c)(3) (along with private foundations), and include arts, culture, and humanities organizations; education organizations; healthcare organizations; human services organizations; and other types of organizations to which donors can make tax-deductible donations. Others are spread across the nearly thirty other nonprofit classifications, which include groups like labor unions and business and professional associations. These mission-based organizations provide jobs and wages as well as opportunities for entrepreneurialism, leadership, and professional development. The considerable growth in the size and reach of the nonprofit economy means more and more Americans are finding themselves working in or for a nonprofit across all major industries. As a result, the sector provides a wide range of paid positions for doctors, researchers, educators, artists, executives, care providers, lawyers, and many others who, along with the subsectors they represent, furnish alternatives to (and in some cases, like nursery schools and hospitals, directly compete with) business and government provision of services and goods. All told, the more than 1.4 million registered nonprofit organizations in 2013 employed over 10 percent of the domestic workforce and accounted for around 5 percent of GDP.
This article provides estimates of the total nonprofit wages and employment for the sector in 2013—the most recent period for which data are available—and analyzes these findings in comparison with the other pillars of the U.S. economy: the government and business sectors.1
Employment
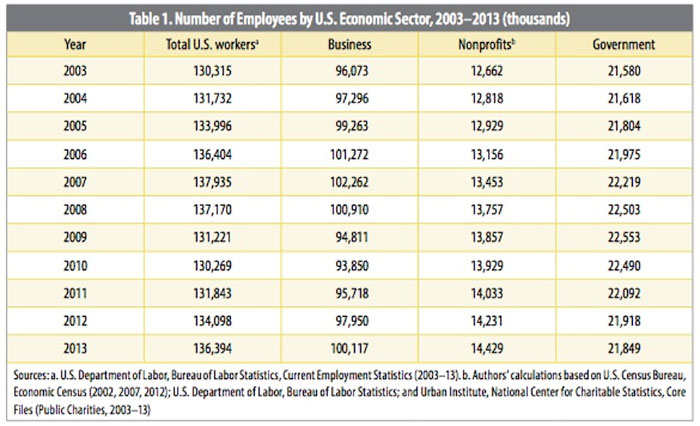
Nonprofits, like all firms, use inputs—labor and capital—to produce goods and services. The nonprofit sector employed over 14.4 million people (estimated) in 2013. Many of these employees are concentrated in the health services and education fields. The nonprofit sector has experienced a period of sustained growth over the past decade. As Table 1 demonstrates, the number of employees increased 14.0 percent from the 2003 level of 12.7 million employees. This represents nearly a percentage point increase in the nonprofit share of the economy, from 9.7 percent in 2003 to 10.6 percent in 2013. A major driver of this employment growth is the increased demand for healthcare services, which is driving growth in hospitals and healthcare organizations. More than half of all nonprofit workers are employed by the healthcare and social assistance industry (54.8 percent), which includes hospitals, mental health centers, crisis hotlines, blood banks, soup kitchens, senior centers, and similar organizations. In 2013, this industry employed over a million more nonprofit workers than it did in 2003, showing the largest absolute growth in number of employees of any nonprofit subsector.
Nonetheless, the nonprofit sector is still the smallest of the sectors in terms of employee count. There are still considerably more people employed by business than by nonprofits—about seven times as many. But over the 2003 to 2013 period, nonprofits outpaced businesses and government in their percentage growth in employment.
Between 2003 and 2007, the years leading up to the recent recession, employment in the nonprofit sector and the business sector grew at a similar rate, both slightly higher than the growth of government employment. Yet, during the recession—from 2007 to 2010—growth in the nonprofit sector outpaced that of government and business employment: nonprofit employment rose 3.5 percent, while government employment remained relatively flat (1.2 percent growth) and business employment fell by 8.2 percent. With the end of the recession, however, the U.S. economy has been rebounding. From 2010 to 2013, nonprofit growth in employment (3.6 percent) was surpassed by renewed growth in business (6.7 percent). On the government side, employment has declined slightly in the postrecession years (2.9 percent).
Wages
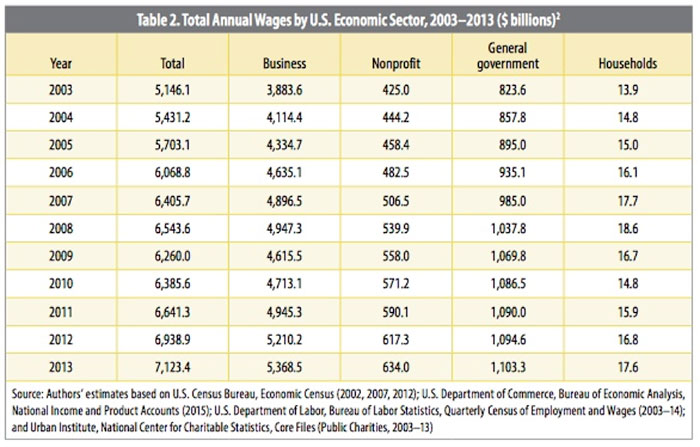
In 2003, nonprofit organizations paid an estimated $425 billion in wages. Ten years later, in 2013, total nonprofit wages had risen to $634 billion. This increase in paid wages represents a growth of 49.2 percent (17.8 percent after adjusting for inflation). In 2013, the majority of all nonprofit wages (57.1 percent) were paid by healthcare and social assistance organizations. In particular, hospitals, residential care facilities, and ambulatory healthcare services account for just under half (49.4 percent) of all nonprofit wages. Wages for hospitals grew from $196.1 billion in 2003 to $313.2 billion in 2013, by far the largest absolute growth of any industry during the same period. Remove hospitals from the employment trend, and nonprofit wages from 2003 to 2013 grow more slowly—40.1 percent, compared with 49.2 percent. The second largest nonprofit industry by wages paid falls under the label “other services.” This subsector accounts for 17 percent of total nonprofit wages in 2013. This category includes grantmaking foundations; fundraising and other supporting organizations; professional societies and associations; groups promoting or administering religious activities; cemeteries; human rights organizations; advocacy organizations; conservation and wildlife organizations; and others. The educational subsector, which includes organizations such as colleges, elementary schools, technical schools, exam-preparation outfits, hockey camps, and dance instruction, makes up the third largest segment of wages, at 16.3 percent. Higher education accounts for two-thirds of educational services wages and over 10 percent of total nonprofit sector wages.
Across all industries, average annual nonprofit compensation increased from $31,501 in 2003 to $43,178 in 2013—a 37.1 percent increase (8.3 percent after adjusting for inflation). These data, however, do not take into account differences in nonprofit wages between staff and executives. Nor do they take into account the significant variation by subsector. The finance and insurance industry and the utilities industry both had average annual wages of about $97,000 per employee in 2013, the highest of any nonprofit subsector. On the other end, nonprofit employees in the accommodation and food services industry received the lowest average annual compensation in the nonprofit sector: under $21,000. The low average pay is in part because this industry includes camp organizations, which hire many seasonal employees. The industry with the next lowest compensation is the social assistance industry, with annual compensation of about $26,500. This industry, which also tends to be among the lowest paying in the for-profit sector, includes community, food, child and youth, elderly, and disabled services.
As noted above, the average annual nonprofit compensation increased by over 37 percent between 2003 and 2013. Yet this growth also varied by industry, as some nonprofit subsectors saw considerable growth in average compensation over the ten-year period, while others did not. At the high end, the average annual compensation for the professional, scientific, and technical services subsector rose about 55.7 percent between 2003 and 2013 (23 percent after adjusting for inflation)—growing from just over $53,000 to about $82,500. The information subsector saw the second highest growth in average compensation, with a growth rate of just under 50 percent (18 percent after adjusting for inflation) between 2003 and 2013—rising from just over $59,000 in 2003 to about $88,500 in 2013. Finally, although the agriculture, forestry, fishing, and hunting subsector reported below-average annual compensation in both 2003 and 2013 (less than $23,000 in 2003 and just under $33,500 in 2013), its average annual compensation grew at a higher-than-average 45.8 percent (15.2 percent after adjusting for inflation).
At the low end, the arts, entertainment, and recreation subsector saw the smallest growth in average annual compensation, increasing from about $24,500 in 2003 to about $29,000 in 2013. This represents a growth of 19 percent (a decline of 6 percent after adjusting for inflation). The transportation and warehousing subsector experienced the next smallest amount of growth between 2003 and 2013, at 25.9 percent (a relatively flat -0.6 percent after adjusting for inflation). The accommodation and food services subsector, in addition to having lower-than-average annual compensation (as noted above), also grew relatively little in compensation between 2003 and 2013—about 27.2 percent (0.5 percent after adjusting for inflation).
Sign up for our free newsletters
Subscribe to NPQ's newsletters to have our top stories delivered directly to your inbox.
By signing up, you agree to our privacy policy and terms of use, and to receive messages from NPQ and our partners.
In addition to paid workers, unpaid volunteers supply billions of hours of time annually. In 2013, the value of volunteers, calculated using average private wages, was worth $167.2 billion to the sector. The combination of nonprofit wages and volunteer labor exceeded $801 billion in 2013, and volunteers accounted for over 26 percent of this combined total.
Even without accounting for volunteer labor, nonprofit wages grew slightly ahead of the business and government sectors in the 2003–13 period (see Table 2).
Contribution to the Economy
Because nonprofits are fairly labor intensive, they make more of a contribution to the economy as employers of labor than to Gross Domestic Product (GDP). In 2014, nonprofits contributed $937.7 billion to the economy, which equates to 5.4 percent of GDP (see Table 3). This is slightly up from 5.2 percent in 2003, but down from the 2009 level of 5.6 percent.
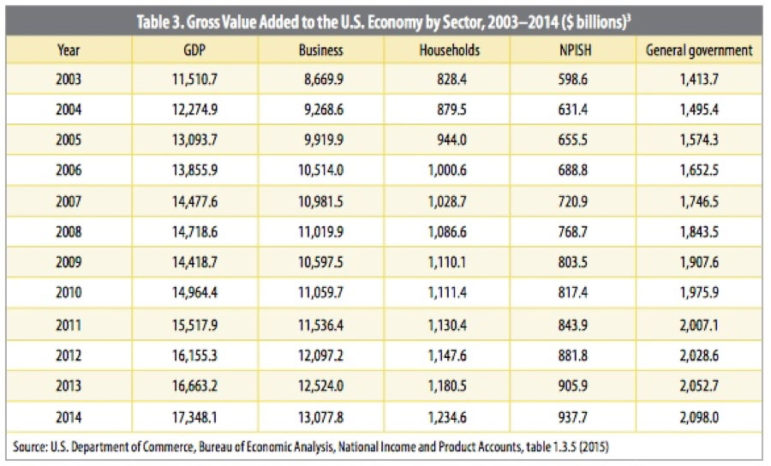
It is important to keep in mind that although these are the best estimates of the sector’s contribution to the economy, these values underestimate the contribution of nonprofits. The Bureau of Economic Analysis (BEA) at the Department of Commerce measures the size of the U.S. economy. It divides the economy into four sectors: government, business, households, and nonprofit institutions serving households (NPISH). The BEA definition of nonprofit organizations varies from the IRS definition. The BEA’s NPISH definition does not include all tax-exempt organizations. It excludes organizations that serve businesses, such as chambers of commerce, and nonprofits such as credit unions and university presses that are also counted as serving business because they sell goods and services in the same ways as do for-profit businesses. Nonprofits that fall under the NPISH definition include those that provide services in one of the following five categories: religious and welfare (social services, grantmaking foundations, political organizations, museums, and libraries); medical care; education and research; recreation (cultural, sports, and civic and fraternal organizations); and personal business (labor unions, legal aid, and professional associations).
…
Readers should note that comprehensive nonprofit employment data are among the most significant and largest areas of missing data on the nonprofit sector. Data on nonprofit wages or employment by industry are not published annually, and what data are available are limited—either by industry or by time periods covered. In addition, the total number of nonprofit organizations operating in the United States is unknown, because religious congregations and organizations with less than $50,000 in annual revenue are not required to register with the IRS.
This article presents the authors’ estimates of nonprofit employment and wages using available data. While these estimates attempt to capture nonprofit-sector employment and wages by combining estimates from both government and nonprofit sources, there is still no single source for nonprofit salary and employment data. The Bureau of Labor Statistics recently released a series of research data on employment, wages, and establishment figures for nonprofit institutions. The BLS data reports employment and wages for organizations exempt under section 501(c)(3) of the Internal Revenue Code but not for the nonprofit sector as a whole.
Notes
- The authors’ estimates throughout this article are based on the following: U.S. Census Bureau, Economic Census (2002, 2007, 2012); U.S. Department of Commerce, Bureau of Economic Analysis, National Income and Product Accounts (2015); U.S. Department of Labor, Bureau of Labor Statistics, Quarterly Census of Employment and Wages (2000–14); and Urban Institute, National Center for Charitable Statistics, Core Files (Public Charities, 2000–13).
- These figures only include actual wages paid; they do not reflect volunteer labor. Values are not adjusted for inflation.
- Value added by the business sector equals gross domestic product excluding gross value added by households, nonprofit institutions serving households, and general government. Government enterprises are classified as part of the business sector, as are nonprofits serving business. Value added by nonprofit institutions serving households equals compensation of employees of nonprofit institutions, the rental value of nonresidential fixed assets owned and used by nonprofit institutions serving households, and rental income of persons for tenant-occupied housing owned by nonprofit institutions. Value added by the general government equals compensation of general government employees plus general government consumption of fixed capital.