Giving USA has released “The Data on Donor-Advised Funds: New Insights You Need to Know,” a report that analyzes giving patterns of the largest administrators of donor-advised funds (DAFs) and their millions of donor-advisors against the giving patterns reflected in IUPUI’s annual Giving USA reports and other national giving assessments. The top-line conclusion from the study’s 56-page report is that the rapidly increasing share of charitable funds held by DAFs largely reflects the general giving patterns of philanthropy as a whole in the US, but there are some significant exceptions.
The growing influence of donor-advised funds as a source of charitable support is explained in the study’s introduction.
According to Giving USA 2017: The Annual Report on Charitable Giving, charitable giving in the United States totaled $390.05 billion in 2016, growing 2.7 percent over the previous year. In that same year, contributions to donor-advised funds grew 7.6 percent to $23.27 billion, almost tripling the overall charitable growth rate. Between 2010 and 2015, contributions to donor-advised funds had an annualized growth rate of 18.3 percent…
Granting patterns for donor-advised funds have been relatively stable in recent years, in terms of which types of nonprofits receive support. As a similar measure of stability, according to the study, only 15 donor-advised fund sponsors (the groups that hold and administer the funds themselves) are identified as having been among the ten largest for at least one year between 2008 and 2014. These 15 nonprofits administering donor-advised funds controlled about 60 percent of all funds held by all DAFs during the seven-year period.

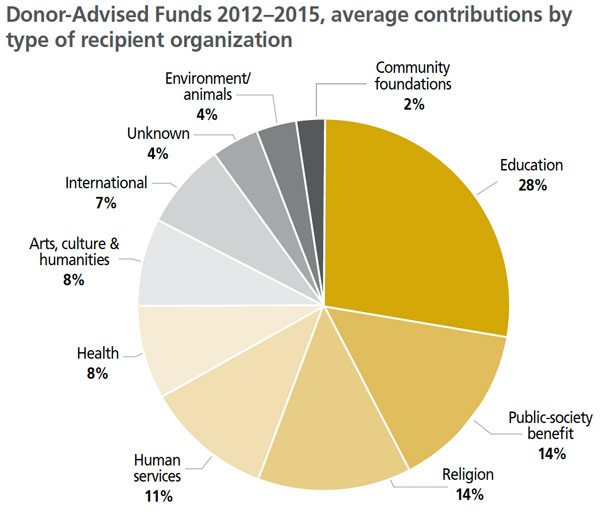
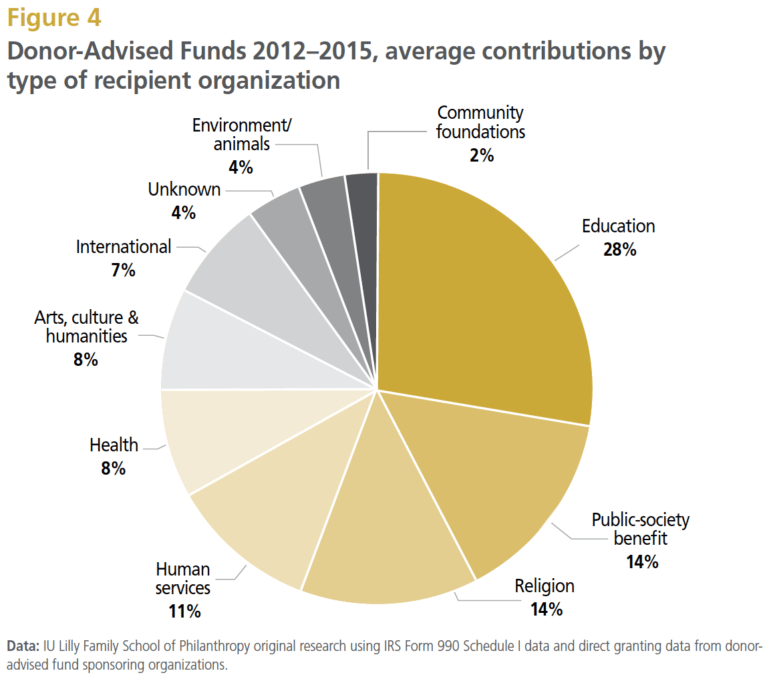
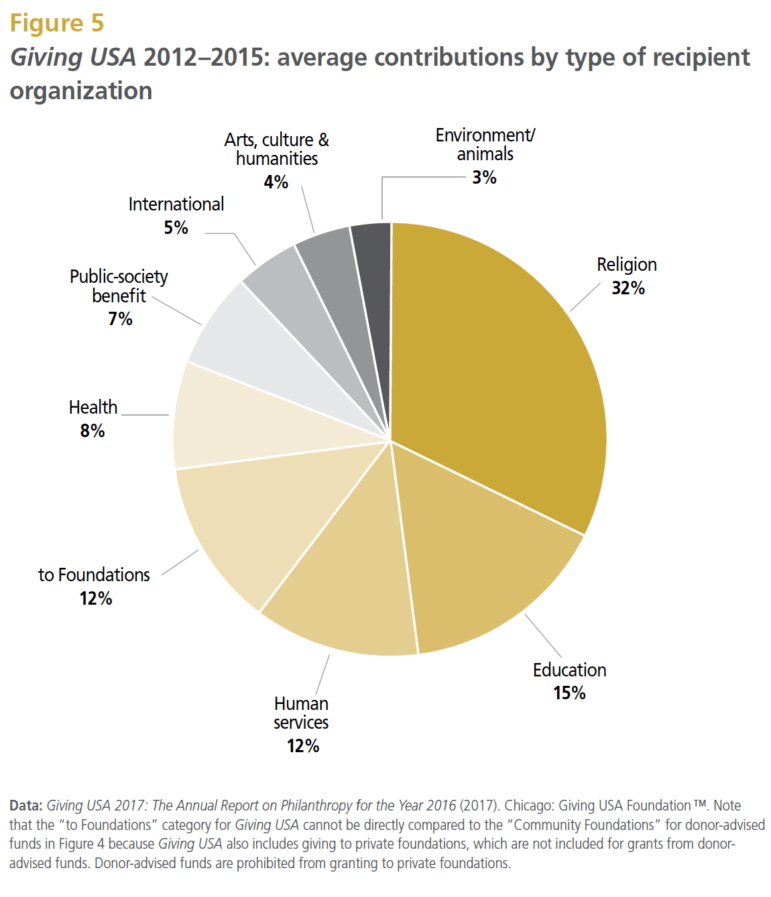
 Looking at the chosen data set, the pattern of giving by donor-advised funds is in line with overall trends, but the differences are noteworthy. Side-by-side pie charts of 2012–2015 Giving USA annual data and DAF data illustrate these similarities and differences. For example, while four percent of all giving is made to “arts, culture, and humanities” organizations, eight percent of DAF giving is dedicated to this group. Similarly, five percent of all giving goes to international causes, while seven percent of DAF giving goes to international causes.
The biggest differences between overall giving and DAF giving, however, are in the areas of religion and education. The gap between overall giving and DAF giving to education and religion is intriguingly pronounced. In the 2012–2015 period, overall giving to religion comprised almost a third of all charitable giving (32 percent) and has been trending downward for some time; in the DAF study, religion accounted for only 14 percent of all DAF giving. Conversely, education represented 15 percent of all charitable giving, but 28 percent of all DAF giving.
Sign up for our free newsletters
Subscribe to NPQ's newsletters to have our top stories delivered directly to your inbox.
By signing up, you agree to our privacy policy and terms of use, and to receive messages from NPQ and our partners.
The reasons for this inversion between all giving and DAF giving are worthy of further study, but would likely require expensive and time-consuming individual interviews, review of profile data on which educational and religious institutions receive support, and the nature of the relationships between donors and the institutions they choose to support.
The report points out that while “there are some similarities between donor-advised fund granting patterns and the national distribution patterns…there are even more similarities when donor-advised fund granting patterns are compared to data on individual donors only.”
Donor-advised fund granting from 2012–2015 reveals that education was the largest recipient category, garnering 25 percent or more of total granting dollars each year. This mirrors findings about high-net worth giving during that time frame: The 2014 US Trust Study of High Net Worth Philanthropy, which studied the giving habits of high-net-worth donors, found that giving to education is also the top priority for this group.
So, the differences between the proportions of giving going to various fields may be explained by understanding that the donors in donor-advised funds are 1) individuals who, at least for now, 2) tend toward a higher than average net worth—though, according to this report, relatively few very high net worth donors use the funds.
One of the report’s two leading data sources—the IRS Form 990 Schedule I—is also a source for the report’s key limitations. The analysis conducted by researchers at the IUPUI Lilly Family School of Philanthropy looked at the granting data contained in Schedule I, which lists grants by a nonprofit (in this case, a DAF sponsor), to other nonprofits, organizations, and individuals. While a rich data source, any study of the nonprofit sector using IRS Form 990 data is inherently limited by the accuracy and completeness of the Form 990 information supplied by nonprofits. For example, the study’s authors note that many DAF administrators only make available the first page of their Schedule I’s list of grants, even though a DAF sponsor, like all nonprofit organizations, is required to report and make available to the public a list of all grants in excess of $5,000, regardless of the number of grants made. Some grants made using DAFs were made to organizations without a reported employer identification number (EIN), so the researchers used a “best guess” approach to matching recipient organization names with general areas of mission focus, such as education, health, etc. Schedule I data is not reported by the IRS in aggregate form and not all data is available in machine-readable format, which means data needs to be entered by hand to be analyzed.
Notwithstanding these limitations, the DAF giving report represents a major step forward in understanding how nonprofits sponsoring donor-advised funds and donors giving through DAFs allocate their charitable resources to the sector as a whole. Ironically, in future years the Form 990 may give us better philanthropic information about donor-advised fund giving patterns than it does about giving more globally. The new tax law is projected to reduce the number of filers who choose to itemize their tax deductions, including identifying charitable gifts. Currently, about 30 percent of individual tax returns are itemized; that number may go as low as five percent beginning with the 2018 tax year. Not only will fewer federal tax returns provide charitable giving information, but that information will be coming from the taxpayers with the highest incomes, whose giving choices might be far different from those made by the general public.
The study was produced with support from Giving USA Foundation™ and the Fidelity Charitable Trustees’ Initiative.


