We at NPQ tried to avoid calling out the report issued by the BDO Institute for Nonprofit Excellence about the financial health of nonprofits for the second year in a row, but it now appears that it would be irresponsible to do so because at least one other well-read publication is writing about its findings as if it holds water for all nonprofits.
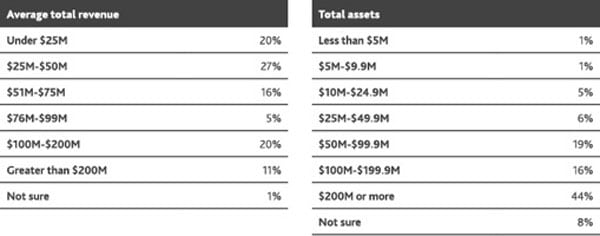
The study, I would warn you, is based on a small sample of 100 that is so high-end that it sorts nonprofits with annual revenues under $25 million as “midrange.” That group makes up only 20 percent of those surveyed; organizations with more than $100 million in annual revenue comprise 31 percent of respondents. And, although this year they make the elite size of those organizations they are surveying quite obvious, the survey continues to engender articles that interpret the study group as if it were representative of the whole sector.
BDO’s Very Rich Sampling
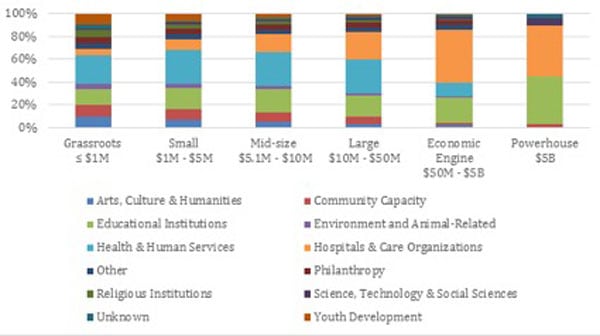
In fact, Kerstin Frailey, writing for GuideStar’s blog, writes that 66.3 percent of US nonprofits have annual budgets of less than $1 million. “From there, as organization size increases,” she notes, “the number of nonprofits decreases. For every one powerhouse (annual expenses more than $5 billion) nonprofit, there are thousands of grassroots organizations.”
She also points out that past a certain size, the categories of nonprofits are pared down considerably in some fairly predictable ways—think eds and meds—and illustrates that with a handy chart.
Sign up for our free newsletters
Subscribe to NPQ's newsletters to have our top stories delivered directly to your inbox.
By signing up, you agree to our privacy policy and terms of use, and to receive messages from NPQ and our partners.
This mismatch of survey sample to the reality of most nonprofits leads to some idiosyncratic findings. For example, the nonprofit organizations surveyed fund an average of 29 percent of their operating budgets through investments. And, when it comes to cash money,
Half of midrange nonprofits have more than 12 months of liquid, unrestricted net assets, and another 10 percent have between seven and 12 months. While midrange organizations have a stronger supply of operating reserves, this does not necessarily signify that those nonprofits have lower operating costs. Instead, it could be an indication that midrange organizations are less likely to tie up their reserves in illiquid assets.
We should all have such problems.
Flowing from that lopsidedness in the survey may come all kinds of misunderstandings, as in a case from Fast Company where Ben Paynter discusses the problems of the very rich as if they represent the full range of nonprofits. The conclusions and analysis go a little haywire from there, with worries about nonprofits’ resistance to mergers and a nod to the “experts” supporting a mandatory reserve for nonprofits. We are all for that, of course, but only if funders want to provide a little extra on the top of every grant to pay for the health of our balance sheets. (Please see this webinar for discussion of a push at funders to fund reserves.) Don’t hold your breath, though, because at least with government funders, we smallish nonprofits and even many larger ones often cannot even get full cost reimbursement.
Finally, the survey authors and Paynter worry about the problem of nonprofits overinvesting in program in some cases as an example of the “starvation cycle.” I swear, sometimes it feels like you are damned if you do and if you don’t. Next year, maybe the survey can be called “The Finances of Massive Nonprofits” or something similar.


