January 29, 2019; CBS News
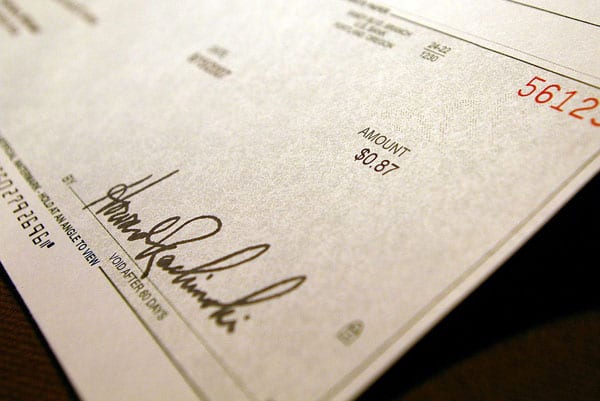
“Millions of middle-class Americans are just one missed paycheck away from poverty,” reports Aimee Picchi for CBS News. Picchi adds that four in ten are considered “liquid-asset poor,” which is defined as lacking “enough savings to make ends meet at the poverty level for three months.”
For a family of four to live at a poverty-line income for three months would cost $6,275. Again, four in ten households have cash savings that fall below this amount. For Latinx and Black households, these numbers are higher, as 62.5 percent of Latinx households and 62.7 percent of Black households have cash savings that fall below this level.
Of course, a family living a middle-class lifestyle can’t shift gears overnight—rent and car payments, for example, don’t disappear just because you don’t get a paycheck. So even if your family had $6,000-plus in the bank, it would be unlikely to last three months.
These findings, Picchi explains, come from a study, titled Vulnerability in the Face of Economic Uncertainty, authored by Kasey Wiedrich and David Newville, released last week from the nonprofit economic advocacy group Prosperity Now. For years, Prosperity Now (once called “CFED,” or the Corporation for Enterprise Development) has released its annual “Prosperity Now Scorecards.” But this year’s report, released just days after a record 35-day federal shutdown ended, is getting more attention, as the economic fragility of so many who consider themselves “middle class” came plainly into view.
As Wiedrich tells Picchi, the shutdown illustrated key points made in the report: “These federal jobs are well paying, they are stable, they give benefits,” Wiedrich observes. “But if you lose that paycheck for a couple weeks, people aren’t able to pay their bills.”
Additional findings from the report include the following:
Sign up for our free newsletters
Subscribe to NPQ's newsletters to have our top stories delivered directly to your inbox.
By signing up, you agree to our privacy policy and terms of use, and to receive messages from NPQ and our partners.
- An estimated 13.2 percent of households fell behind on their bills in the past year. For Latinx households, that number increases to 16.9 percent and, for Black households, 24.3 percent.
- Households that include a person with a disability find keeping up with bills especially difficult. In 2018, 28.4 percent of such households fell behind on bill payments.
- An estimated 19.6 percent of Americans lack credit access, including 31.2 percent of Latinx households and 35.9 percent of Black households.
- An estimated 10.9 percent of whites and 17.2 percent of Blacks decided to skip at least one doctor’s visit due to cost.
- Almost half (48.1 percent) of US households have credit scores that fall outside the “prime” category (leading to higher interest charges).
The report also offers a snapshot of other economic trends. For example, median student loan debt continues to rise, reaching $18,366 in 2018, with 15.2 percent of borrowers currently with delinquent status. The rate of children with health insurance, which had fallen since the Affordable Care Act was passed, climbed in 2018 from 6.1 percent to 6.9 percent.
A companion report, authored by Solana Rice, Lebaron Sims, Jr., Holden Weisman, and Emma Polson, titled Accounting for Race: A New Way to Compare the Financial Health of Households in States, breaks income insecurity data down to the state level. Some of the trends are not unexpected—many of the states with the greatest economic insecurity are in the South, while many northern states do better. But states do not always follow these regional patterns. For instance, Pennsylvania falls in the lowest category (highest economic insecurity), while Virginia ranks among the top tier of states. The report also finds that racial disparities are lowest in Maryland, but highest in Minnesota. Overall, the five states with the least economic insecurity are (in rank order) Vermont, Hawai’i, New Hampshire, Washington, and Utah. On the other side of the ledger, Louisiana has the highest economic insecurity and is followed in rank order by South Carolina, Mississippi, Alabama, and Washington, DC.
The chart below illustrates what the differences mean in people’s lives.
| Vermont | Louisiana | |
| Households that fall behind on bills | 10.6% | 17.7% |
| Adults forgoing doctor visits due to costs | 8.8% | 17.1% |
| Student loan delinquency rate | 9.7% | 19.7% |
| Underemployment rate | 6.1% | 9.1% |
Can policy help? Both reports offer suggestions. Wiedrich and Newville recommend boosting financial security through safety net programs, increasing consumer protections, supporting affordable homeownership, changing the tax code to encourage savings by low-income households, and providing government-funded universal child savings accounts at birth.
States, note Rice and her coauthors, can pass (as 29 states and DC have done) state earned income tax credit laws and remove asset caps that counterproductively kick residents who save off of benefit programs. Broader suggestions are listed in a Prosperity Now report from last fall and its companion report on racial equity.
Rice and her authors caution, however, that policy, absent structural changes, will only get you so far. Policies, they note, “are not silver bullets that can instantly solve deep racial wealth disparities. They are a start to a process that can lead states to a more prosperous future for all individuals, families and communities.”—Steve Dubb


