

Editors’ note: This article is based on chapter 6 of Finance Fundamentals for Nonprofits: Building Capacity and Sustainability (Wiley & Sons, Inc., 2011).
Nonprofits need profit. Because every nonprofit is unique, the amount depends upon individual circumstances. This article will identify the key variables and explain how any organization can calculate the minimum profit it needs to prevent slow, steady erosion of the quality of its output. The calculation is so simple it can be done without pencil and paper, but it has far-reaching implications.
The key variable is capital. It is obvious that organizations should continually invest in their capital to keep it in top condition, but this is an elusive goal. When money is tight, managers may not be able to resist the temptation to skimp on investment, because the negative consequences are remote. Even managers with the best intentions may invest too little because they do not have a well-grounded investment target. What they need is a theory-based investment model.
Here is the theory. Economic models of production are a function of the particular combination of land, labor, and capital an organization uses. (A combination of resources is like a cookbook recipe—so much of this and so much of that.) In nonprofit organizations, every service-delivery model employs an ideal combination of resources. If the actual combination departs from the ideal, the quality of service will suffer. Once an organization chooses a particular service-delivery model, it must utilize more of every resource (more land, more labor, more capital) to produce more output at constant quality. Conversely, if it reduces the amount of every resource in the same proportion, it will produce less output but quality will stay constant.
Reducing the amount of a single resource implicitly changes the service- delivery model. For example, if an organization uses less capital without changing the amount of labor in the same proportion, the quality of its services will suffer. (Like using fewer eggs in a cake without reducing sugar, flour, etc.) No nonprofit organization would be so foolish as to throw away capital, but it might carelessly allow it to wear out or become obsolete, which amount to the same thing. Some organizations try to avoid steady erosion of quality by investing an amount equal to depreciation, but this is not enough. This tactic only maintains the value of assets at their original cost, which is insufficient, because inflation constantly pushes up replacement cost.
The capital investment needed to maintain the status quo in a given year is the rate of inflation (r) multiplied by total assets (A) on hand at the beginning of the year, which is how accountants measure capital. Division by spending on operations (S) converts this number into the minimum percentage of an operating budget that managers should set aside for investment. It is easier to solve this problem mentally by changing the sequence of calculations. Divide total assets by spending on operations, and then multiply by an inflation rate.
Status quo profit rate = (A / S) • r
In accrual accounting, spending on operations is total expenses minus the non-cash expense, depreciation. Viewed prospectively, this approximates the size of an operating budget. (An operating budget excludes investment, but I will say more about budgeting later.) Users of cash accounting and endowed organizations need to tweak this formula, but I defer this discussion for the moment. I will also say more about the inflation rate later on, but for the purpose of illustration I will use a figure of 3.4 percent that I have calculated for the average rate of increase in the Consumer Price Index, All Urban Consumers (CPI-U), over a ninety-one-year period.1 Notice that the status quo profit rate is based on spending, not revenue, which is a popular base from which to measure profit rate.
The formula shows at a glance that organizations with a large asset base and a small operating budget need a higher rate of profit than organizations with negligible assets and a large operating budget. Incidentally, it also shows how organizations can get into trouble when they decide to buy the building they currently rent. Overnight, their assets-to-spending ratio goes from low to high, which requires them to become more profitable immediately. If they fail to grasp their new responsibility for making capital investment, problems will soon surface. I want to emphasize that the above formula shows the status quo profit rate. Growth requires greater investment and more profit.
A couple of examples may help solidify these ideas. I used 2012 data from GuideStar to compare my university with a small local theater company.2 My university has a huge campus, whereas the theater company performs in an old retail store. Both own their facilities. However, my university, with a large campus and a budget of $667 million, has a lower assets-to-spending ratio than the theater company, with a budget of $0.3 million. The university’s ratio is 1.8 and needs a profit rate of 6 percent to maintain the status quo, whereas the small theater company’s ratio is 3.0 and needs a profit rate greater than 10 percent.3 Incidentally, another theater company with a similar budget that performs in rented space has a ratio of 0.5 and needs only a 1.7 percent status quo profit rate.
It may seem strange that a university that owns many buildings (including a theater) would have a higher assetsto- spending ratio than a small theater company that owns an old store. However, the average productivity of the university’s capital is greater than that of the theater company’s capital. The university’s pricing policy and its ability to fill seats imputes greater productivity to its assets. This observation conveys an important lesson for nonprofit organizations: they can reduce their need for profit by squeezing more productivity out of their assets. The consulting work I do in my spare time has convinced me of widespread inattention to this point.
Sign up for our free newsletters
Subscribe to NPQ's newsletters to have our top stories delivered directly to your inbox.
By signing up, you agree to our privacy policy and terms of use, and to receive messages from NPQ and our partners.
Occasional failure to meet the status quo profit rate is nothing for managers to worry about, provided that surpluses in other years compensate. Even consistent failure to meet this target does not portend demise, but it should put managers on notice of a need for periodic capital campaigns to upgrade their facilities. The formula enables managers to calculate how large a capital campaign they will need. The data in the table below indicate the size (in millions of dollars) of a capital campaign that will be needed to support a new $100 million investment in physical plant under different assumptions about a shortfall in the profit rate and how long an organization waits before conducting one (its planning horizon). The table appears in my book Finance Fundamentals for Nonprofits: Building Capacity and Sustainability.4
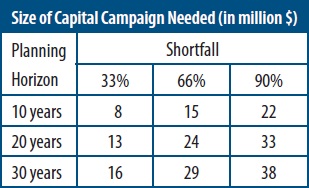
How a manager would use this table is best shown by an example. Assume that a nonprofit organization that needs a 6 percent profit rate but only generates 4 percent has a 33 percent shortfall (first column). It could wait ten years (first row) to replace this shortfall with an $8 million capital campaign. An equivalent interpretation of this example is that $8 million would be the price of a ten-year annuity (invested at a 5 percent rate of interest) that would exactly replace the shortfall. By equating the target of a capital campaign to the purchase price of an annuity, it becomes apparent that all of the numbers in the table will increase when the interest rate falls below 5 percent, and they will decrease when the interest rate on those securities rises above 5 percent. (I recommend using a benchmark rate corresponding to the yield on high-quality tax-exempt bonds issued by large nonprofit organizations.)
This completes an overview of the formula for the status quo rate of profit. The discussion will now fulfill the promises made above with respect to deferred topics, such as measurement of key variables; how users of cash accounting and endowed organizations should modify the formula; and how nonprofit organizations should budget for capital improvements. A question introduces each topic:
- Why are land and securities included in “total assets” variable, since neither wears out or obsolesces? Ideally, we should subtract land from total assets and use only the balance in the formula, but neither financial statements nor 990 forms separate the value of land from the value of buildings. Including land is simply an expedient, which is unlikely to materially distort the calculation of the status quo profit rate. Although securities do not wear out, they finance uneven cash flow and serve as an operating reserve in case of budget shortfalls. To maintain their purchasing power at a constant level, they too must grow at the rate of inflation.
- Is the long-run average rate of growth in the CPI-U the best number to use for the inflation rate? All inflation metrics are problematic. Consider three issues. (A) Inflation varies from region to region and city to city. There are inflation data more representative of local conditions, but their availability is spotty. (B) Inflation in the prices of goods purchased by nonprofit organizations differs from inflation in prices of consumer goods. Fortunately, the U.S. government also publishes data on producer price indexes. Users of price indexes must decide which one is the most representative of their “industry.” (C) All price index data is historical. Managers may prefer to use a prospective inflation rate; fortunately, what buyers of government securities think inflation will be in the future is easily estimated by subtracting the yield on Treasury Inflation-Protected Securities (TIPS) from the yield on an ordinary U.S. Treasury bond of comparable maturity (currently 2.3 percent for the next thirty years). An organization that adopts this method must doggedly stay with it through episodes of high as well as low interest rates. A long-run historical rate is probably a safer bet.
- How should users of cash accounting modify the formula? My research indicates that approximately half of nonprofit organizations use cash accounting. Unlike accrual accounting, which is standardized through generally accepted accounting principles (GAAP), cash accounting is not standardized. I will assume that all cash outflows—for whatever purpose (including investment)—are spending, and no assets are depreciated. Thus, users of cash accounting should redefine total assets to be the sum of the original cost of physical assets and the market value of financial assets. They should also redefine spending to be total cash outflow minus capital investment.
- How should endowed organizations modify the formula? My research indicates that approximately one in ten nonprofit organizations can perpetually finance at least 5 percent of their operating budgets with their securities holdings. These organizations are either endowed or have enough financial wherewithal to establish an endowment-like fund. They should redefine total assets to be that portion of their assets that are not functioning as endowment.
- How should a nonprofit organization incorporate capital investment into its budgeting process? All nonprofit organizations should have two budgets—an operating budget and a capital budget. An operating budget should provide for regular and routine spending that is financed with current revenue. However, capital spending is episodic and often financed with debt, so it should be segregated from the operating budget. There should be a separate budget for capital investment. The two should be linked with a line item in the operating budget to provide a steady source of funding to the companion capital budget. Interest— but not principal repayment— should be in the operating budget, and principal repayment should be in the capital budget. (This structure makes comparison with financial statements easier.) Cash generated by the profit policy advocated in this article becomes a regular and routine transfer to the capital budget.
Regardless of your budget’s structure, you should have an investment plan. Do not simply rely on whatever is “left over” to finance capital investment. Take care of your capital, and it will take care of you.

NOTES
- U.S. Department Of Labor, Bureau of Labor Statistics, “Consumer Price Index: All Urban Consumers (CPI-U); U.S. City Average,” November 20, 2013 (Washington, DC: Government Printing Office, 2013), ftp://ftp.bls.gov/pub/special.requests/cpi/cpiai.txt.
- GuideStar is a nonprofit organization that posts IRS 990 reports on its website (www.guidestar.org) for public use. Although these data are public, I do not identify the organizations I use as examples to avoid even a hint of criticism where none is intended.
- Financial analysis is not an exact science, so when calculating an assets-to-spending ratio, drop the last several digits from both the numerator and denominator, taking care to drop the same number of digits from each. For example, I rounded off to the nearest million by dropping six digits from my university’s assets and spending. I mentally divided assets of $1,200 million ($1.2 billion) by spending of $667 million (two-thirds of a billion).
- Woods Bowman, Finance Fundamentals for Nonprofits: Building Capacity and Sustainability (Hoboken, NJ: John Wiley & Sons, Inc., 2011), 88. Winner of the 2013 Virginia Hodgkinson Research Prize for the “best book on philanthropy and the nonprofit sector that informs policy and practice.”