Editors’ Note: These articles are commentaries on the findings in the 58th consecutive edition of Giving USA: The Annual Report on Philanthropy, the semi-annual report on charitable giving published by the Giving USA FoundationT, researched and written by the Indiana University Lilly Family School of Philanthropy. As the press release notes, “Giving USA’s annual estimates are based on econometric models using tax data, government estimates for economic indicators and information from other research institutions.” Nonprofit Quarterly has published commentaries and reactions to the Giving USA findings for some years now as well as joining Indiana University’s Patrick Rooney, associate dean of academic affairs and research at the Indiana University Lilly Family School of Philanthropy, in a discussion of the issues and questions raised by the report, scheduled for June 26th at the Bradley Center for Philanthropy and Civic Renewal at the Hudson Institute in Washington DC.
The overarching news that this year’s Giving USA report shows us is that we are still climbing only very slowly out of the recession. (If you remember, the title of last year’s NPQ report on Giving USA was, “Giving USA 2012 Indicates Long Slow Uphill Slog…If We Are Lucky.”)
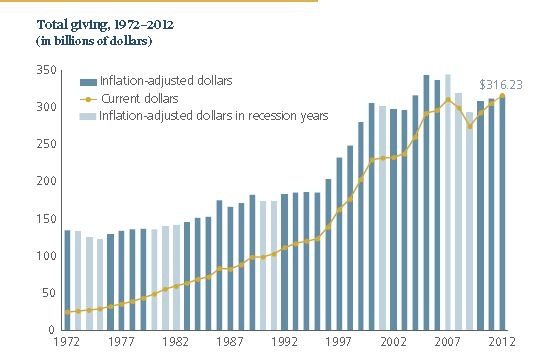
So although giving has increased by 3.5% in real dollars and 1.5% in inflation-adjusted dollars, giving overall is still down 8% in inflation-adjusted dollars from where it was in 2007. Is this five-year (so far) recovery on par with those that followed earlier recessions?
Looking at the graph below, we appear to be setting a record for slowest recovery.

With the depth of this recession, giving declined precipitously—by about 15 percent in 2008 and 2009 combined, adjusted for inflation. In terms of time taken for recovery, it only took three years after both the 1973-1975 recession and the 2001 recession for giving to meet or surpass the total giving level seen prior to the recession. But as of 2012, giving is still well below pre-recession levels, four years later.
IUPUI points out that the rate of growth in giving is right on par with the average post-recession recovery rate over the past 40 years and that is right but the average obfuscates the fact that the growth rate has slowed enormously. Specifically, since 1972, the average inflation-adjusted rate of change in total giving in the three years following each recession was 2.6 percent and foror the years 2010 to 2012, the average inflation-adjusted rate of change in total giving was 2.5% so that is in line, but this rate seems to be slowing, with much of the growth in giving during that three-year period having occurred in the first year of the recovery. Giving grew by about 5% (adjusted for inflation) in 2010, by about 1.5% adjusted for inflation in 2011, and in 2012, it grew only about 1% adjusted for inflation. As we predicted, a long, slow, uphill slog.
But there also may be some significant changes as it comes back; this year, NPQ is most interested in two categories of the report: giving to public benefit organizations and giving from corporations. We are also very interested in what has happened with regard to giving to health, but we suspect that that may be related to the corporate question. The change from a slight reduction in corporate giving last year to a big increase of nearly 10 percent this year is too unusual to not look into deeply. (See Rick Cohen’s box below.)
Public Benefit Organizations
Public benefit organizations, a category that includes intermediaries like donor-advised funds and United Ways, saw giving increase by 5.4%. The fact that $54 million included in this category went to Hurricane Sandy relief, combined with phenomenal growth in the money going into donor-advised funds, suggests that the amount of money going to the rest of those in this category has either stagnated or, more likely, been reduced significantly.
Contributions to the big three national DAF sponsors—Schwab, Fidelity, and Vanguard—were up 44 percent in 2012 as compared to the previous year, according to Schwab Charitable’s president and CEO, Kim Laughton. While the Big Three do not tell the whole story of donor-advised funds, it suggests that other funding intermediaries in this category, like the United Ways, the Combined Federal Campaign and the Jewish Federations of North America, are more than likely not growing. We know that the Combined Federal Campaign did see a drop of $14.3 million from 2011 to 2012, or 5.2% of their campaign. Perhaps more notably, there was a drop off by donors of more than 10 percent.
Why should we care about this tradeoff? Quite simply, while the money raised in those combined campaigns is almost immediately turned around into grants, the same cannot be said about donor-advised funds. Compared against most foundations whose payout floor against assets is 5%, the 17% estimated payout of donor-advised funds looks great, but it does not look nearly as healthy when compared with the far larger annual payout of Federated workplace campaigns. The development of the personal giving mechanism of the donor-advised fund is clearly the way of the future, but it will mean that there may be fewer immediate payoffs in this category than the numbers might suggest.
Patrick Rooney has promised that the effects of the growth of donor advised funds is one of the details on which they will drill down further in one of the Spotlight publications that they will do for Giving USA, and he says they would like to break this topic out further as a regular part of Giving USA. We will be working on the same thing here at NPQ.
Other Findings
Don’t get us wrong; it appears that some categories of recipients have seen legitimate gains over the last year, recovering from the cratering caused by the recession. Giving to the arts, for instance, looks like it may be recovering, although for some organizations, deficits caused by unfortunately timed investments made in programming or facilities have caused problems that now need to be remedied. The growth of giving in this area from last year to this is even more striking when you consider that last year, the giving in that category was inflated by one $800 million gift to one museum.
The largest category of giving—to religion—is trending downward, and according to Patrick Rooney, that’s a long-term trend. Most of the giving in this category is from individuals. He says that each generation is giving less than the last, and that giving to religious organizations is now a third of total giving, where a few decades ago, it was more than half. Still, it constitutes two-thirds of household giving.
In human services, if we take out the money spent on Sandy, it is very likely that there has been no growth, and even a small negative trend.
Giving to health is up, which is somewhat confounding because historically, when the government makes a major and well-lauded investment in an area, private giving lessens. This has not been the case with Obamacare and private giving. NPQ suspects that the increase in corporate giving is from Pharmaceutical companies and is likely gifts in kind. According to a survey done in 2011, 19% of what was given by corporations were gifts in kind.
No Growth without Limits, and Concentrating on Donor Vehicles Rather than the Numbers
The recovery in giving is slower than usual following this past recession, and inherent in that slow growth is a lot of change in the way giving is done and the way money flows within the sector. NPQ has tried to cover some of those we can speculate about in an informed way but we believe there are a lot of differences that we are unable to identify right now. We encourage readers to look at the package provided by Giving USA yourselves and make some speculations of your own. Those hypotheses are a first step towards making meaning of all this data, and maybe we can get IUPUI to investigate your questions more fully through the coming year.—Ruth McCambridge
Sign up for our free newsletters
Subscribe to NPQ's newsletters to have our top stories delivered directly to your inbox.
By signing up, you agree to our privacy policy and terms of use, and to receive messages from NPQ and our partners.
Rick Cohen on the Confusing Picture of Corporate Giving - 2012 Who would have ever guessed it? The latest Giving USA report says that corporate philanthropy in 2012 increased from the previous year by 12.2 percent in nominal terms, 9.9 percent in inflation-adjusted dollars, to $18.15 billion. That figure reflects all corporate giving—cash, grants, and in-kind donations, which are typically donations of material products. In fact, the growth in corporate giving was so large that corporate giving’s share of total charitable giving in the U.S. increased by a full percentage point. It must strike the millions of American workers who have been laid off from their jobs in the corporate world during the long and deep recession as anomalous. They can’t get their jobs back, because corporations and other sectors are hiring so slowly that it will take until 2020 before the U.S. economy reaches pre-recession unemployment conditions. How is it that corporations are shelling out philanthropic dollars so generously when their overall economic behavior doesn’t appear to match? Perhaps corporations are a vanguard, so to speak, of the increasing growth and vitality of the American economy, and corporate philanthropy might be a leading indicator. Compare the growth in corporate giving reported by Giving USA to two other indicators of economic health—the Dow Jones average, reflecting stocks, and the unemployment rate.
Unemployment rate from https://data.bls.gov/timeseries/LNU04000000?years_option=all_years&periods_option=specific_periods&periods=Annual+Data Corporate giving numbers from Giving USA annual reports
Since the end of 2012, the stock market has hit record highs; last week, it closed at 15070. As of May of 2013, the unemployment rate had fallen to 7.6 percent. While the unemployment rate remains far away from our conception of full employment and GDP growth has hardly been rapid, growing at a rate of around 4 percent or less in real dollars during the past three years, which is around 2 percent in inflation-adjusted dollars, the economy is, on a macro-level, pulling out of the depths of the recession. Nonetheless, the growth in corporate philanthropy clearly stands as out of the ordinary. A 12.2% increase in corporate giving between 2011 and 2012 is much more positive than a 7.25% increase in the Dow or 4% increase in the GDP. If it is only a blip of sorts, then it is one that is difficult to dismiss. Other research suggests that corporate charitable giving is associated with future revenue growth, not the other way around, and that the anecdotal commentary about how corporate giving is meant to show up as strategically beneficial to the bottom line of corporations involved; that is, “that firms will not substantially invest in corporate giving unless it adds economic value.” The Giving USA statistic includes giving from corporate foundations within overall corporate giving totals. Corporations that do not give through corporate foundations are not required to reveal their charitable giving, so the bulk of corporate grantmaking—cash and in-kind—occurs outside of entities that report their giving on 990PF forms. The gap between total corporate giving as reported by Giving USA and corporate foundation giving reported by the Foundation Center seems to be significant, suggesting that most corporate philanthropy is distributed without much public disclosure:
Corporate foundation grantmaking totals from https://www.foundationcenter.org/findfunders/statistics/pdf/02_found_growth/2011/01_11.pdf The top 50 corporate foundations accounted for $2.87 billion in corporate grantmaking in 2011, which, if the Foundation Center reporting is comparable in this instance, would account for 55.5 percent of all corporate grantmaking. Whether in direct giving or corporate foundation giving, a relatively small number of corporations were responsible for the bulk of corporate charity in 2010:
Source: IRS Corporation Source Book In other words, less than 0.07 percent of corporate tax filers with net income were responsible for just about four-fifths of all corporate charitable deductions in 2010. For all corporate tax filers with or without net income, less than 0.05 percent accounted for more than 81 percent of corporate charitable giving. Although there are many corporate players in the U.S., and many corporate givers, the aggregate numbers on corporate charitable giving largely reflect the dominance of a tiny handful of corporations. Strikingly, among corporate foundations prior to 2012, the largest corporate foundations in terms of grantmaking were in the pharmaceutical industry. In 2011, the two largest were Sanofil-Aventis and Novartis; four of the top 20, and eight of the top 30, were the foundation arms of pharmaceutical manufacturers. Some of those large pharmaceutical companies are “patient assistance” foundations, providing financial support to individuals in purchasing prescription medicines, but pharmaceutical companies are also huge givers of in-kind products. According to CECP, the Committee Encouraging Corporate Philanthropy, “Noncash contributions as a percentage of total [corporate charitable] contributions [through corporate foundations and direct contributions] grew in aggregate from 57 percent in 2007 to 69 percent in 2012. Pharmaceuticals companies account for the majority of non-cash giving—[although] excluding Pharmaceuticals companies from the analysis shows a similar trend with all other companies increasing non-cash giving from 28 percent (2007) to 39 percent (2012) of total giving.” In 2011, healthcare corporations topped the CECP corporate giving survey in terms of median total giving as a percentage of revenue (0.26 percent for healthcare corporations, compared to 0.12 percent for all corporations in the CECP survey) and median total giving as a percentage of pre-tax profit (1.32 percent, compared to 0.95 percent). Non-cash donations of product may be even a profit maximization strategy on the parts of some corporations, according to Giving USA’s Patrick Rooney in an interview with Ruth McCambridge. Corporations can donate excess inventory at wholesale prices, getting a charitable donation for the less-than-market-value transaction while saving storage and warehousing costs. There’s no question that the pharmaceutical companies have been doing well as profit-maximizers, as this chart of the top pharmaceutical companies’ revenues and profits in 2012 shows:
Source: CNN Money
Ethan Rome of Health Care for America Now says that the top 11 global pharmaceutical companies pocketed $711 billion in profits in the ten years ending in 2012. They have been raking in money under the realm of various insured healthcare programs, such as the Medicare Part D prescription drug program in 2006. Is the growth of corporate charity in 2012 a reflection of the corporate healthcare industry’s seeing even further potential for substantial profits? If so, perhaps the charitable giving increase reported in Giving USA is a minimal corporate investment in anticipation of a comfortable corporate future under the Affordable Care Act. Despite the difficulty in divining exactly which parts of a complex corporate sector are contributing to the uptick in corporate charitable giving, most Americans—not just the unemployed, but those with jobs, too—probably find it a bit disconcerting. Corporate profits have risen 171 percent during the first four years of the Obama Administration, the highest increase of any four-year president’s term since World War II, and are at their highest level as a proportion of the economy since the government started keeping that statistic in 1947. The earnings of wage and salary workers have not progressed anywhere near as rapidly as corporate profits:
Source: Bureau of Labor Statisticshttps://data.bls.gov/pdq/SurveyOutputServlet As ThinkProgress notes , corporate profits have risen 20 times faster than workers incomes since 2008. In fact, at an annualized rate of 20.1 percent, corporate earnings have increased much more rapidly than corporate giving. Rooney told McCambridge that profits are so high that, although “for the last 40 years the total corporate giving has averaged less than 1 percent of total corporate profits…last year, in the last couple of years in a row, it’s averaged 0.8 percent.” Nonprofits, as well as wage and salary workers, see corporations sitting on $1.7 trillion in cash reserves that isn’t going out as either corporate charitable giving or as investment for new hiring, though that only counts what corporations keep in domestic accounts. Are we supposed to cheer the increase in corporate giving as beneficial for the U.S. nonprofit sector? Or are we supposed to perceive the problems behind these statistics concerning the corporate contribution to the health and well-being of the households and communities nonprofits serve?—Rick Cohen |
||||||||||||||||||||||||||||||||||||||||||||||||||||||||||||||||||||||||||||||||||||||||||||||||||||||||||||||||||||||||||||||||||||||||||||||||


