NPQ is still watching cases of organizations that have gone under because of problems they experienced during the big recession. Forewarned is forearmed, and a “conditions of instability” caveat to this report must be taken seriously.
The 21-page Philanthropy Outlook 2017 & 2018 is the third edition (first edition available here) of a collaborative effort between international fundraising consulting firm Marts & Lundy and the Lilly Family School of Philanthropy at Indiana University.
The Philanthropy Outlook both informs and helpfully reminds readers that “American donors of all types contributed an estimated $373.3 billion to approximately 1.2 million U.S. charities in 2015, amounting to 2.1 percent of U.S. GDP. American philanthropy is estimated to have grown 18.7 percent between 2011 and 2015, or at an average rate of 4.7 percent each of those years.”
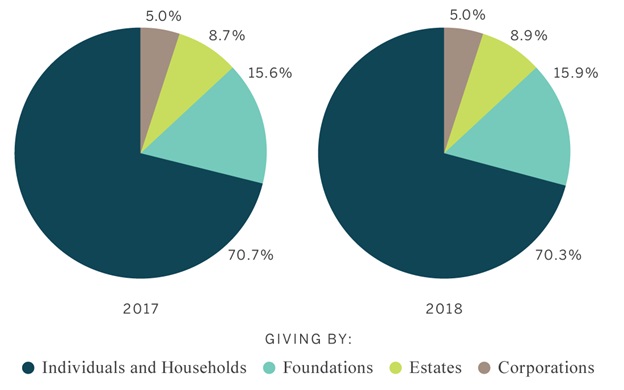
The following chart shows Philanthropy Outlook’s predictions for total giving by source over the next two years:

If the chart looks a lot like the annual reports published by the Giving USA Foundation, there’s a good reason. Those reports are also researched at the Lilly School, and are cited as a key resource for giving growth rates in the Philanthropy Outlook report.
Sign up for our free newsletters
Subscribe to NPQ's newsletters to have our top stories delivered directly to your inbox.
By signing up, you agree to our privacy policy and terms of use, and to receive messages from NPQ and our partners.
Looking at charitable data over the long term, it’s difficult to argue with Michael O’Neill’s statement in his book, Nonprofit Nation, that “If the history of the U.S. nonprofit sector in the last fifty years demonstrates anything, it is that virtually all measures will change, most of them upward, and that some measures will change significantly even in the space of a few years. However, there is a great deal more stability in the percentages—the proportions.” Even if the proportions remain constant over the long term, it’s still important for nonprofits, policymakers, and sector leaders to track the year-over-year volatility to assess the landscape and make both strategic and operational course corrections.
Giving growth across all sector components is expected to increase at a rate greater than the 10-year average of 0.9 percent, but below the 25-year and 40-year growth averages. Among the top-line giving estimates and findings:
- Total giving in 2017 and 2018 should increase by 3.6 percent and 3.8 percent respectively.
- Individual and household giving, 71 percent of total giving, is estimated to increase by 3.0 percent and 3.2 percent in 2017 and 2018, respectively.
- Corporation giving, 5 percent of total giving, in 2017 and 2018 is predicted to increase by 2.4 percent and 2.7 percent, respectively.
- Foundation giving, about 15 percent of total giving, should increase at 5.9 and 6.0 percent for 2017 and 2018.
- Estate giving, estimated at 9 percent of total giving and always less predictable than other giving due to investment performance and the influence of a few large estates each year, should increase by 5.4 percent and 5.2 percent in 2017 and 2018, respectively.
The report website’s homepage emphasizes data on giving to education, health, and public-society benefit. Giving for health is anticipated to increase by 8.5 percent in 2017 and 7.9 percent in 2018, surpassing 10-year, 25-year, and 40-year growth rates. Public-society benefit organizations should see 2017 giving increase by 5.2 percent and 2018 giving increase by 5.4 percent, exceeding 10-year and 25-year growth rate averages. Education giving is slated to increase by 6.3 percent in 2017 and 6.0 percent in 2018, exceeding the 10-year growth average but falling short of the 25-year and 40-year averages for the sector.
In the section titled “Conditions That Will Affect the Outlook for Giving,” the survey authors point out that estimates are based on historical giving patterns and factors, including an estimated GDP annual growth rate of close to 3.0 percent in 2017–2018, which would reflect a relatively strong economy and sustained moderate economic growth. Low inflation, unemployment, and core interest rates are factored into the estimates.
One factor that remains impossible to quantify as 2017 begins is the impact of the outcome of the U.S. presidential election on policies that affect nonprofits and philanthropic contributions. The report does cite the post-election spikes in giving to nonprofits “that work in the areas of civil and human rights, the environment, and support of minority groups,” however, and makes this speculation:
[T]he new president-elect’s policies are likely to be a boon to the general financial sector. The new administration’s plans to cut taxes are expected to expand both public spending and infrastructure. These potential policy trends may help to boost philanthropic giving from corporations, foundations, and wealthy donors, in particular.
Fortunately, the study includes long lists of how and what changes to the model assumptions might affect the estimates positively or negatively, as well as the stability of the variables used. Near the top of that list of considerations should be the uncertainty surrounding the new president’s agenda and its potential effect on the economy as a whole—not to mention sectors like healthcare, human services, and social services with huge client bases of people in need. There are many who would argue that incipient regime change in Washington is a classic definition of “instability” for the nonprofit sector.


