
June 25, 2015; Wall Street Journal Blogs
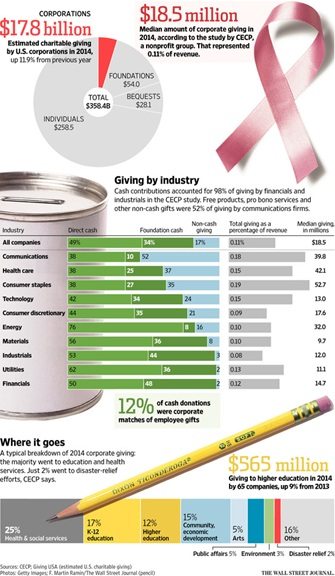
Using figures from the Committee Encouraging Corporate Philanthropy (CECP) and Giving USA, the Wall Street Journal produced this infographic providing useful corporate giving information about such things as cash giving vs. in-kind giving, breaking that down by industry.
As we already know, corporate giving was reported in Giving USA to be up 11.4 percent this year. According to the chart below, and perhaps unsurprisingly, the industries that give the most generally have the highest proportions of in-kind giving. They are communications, healthcare, and consumer staples.
Sign up for our free newsletters
Subscribe to NPQ's newsletters to have our top stories delivered directly to your inbox.
By signing up, you agree to our privacy policy and terms of use, and to receive messages from NPQ and our partners.
What does not appear on this chart is the broader context. As we wrote this, the CECP website was down, but as we reported previously, corporate giving in 2014 was at a relatively low 0.7% of pre-tax profits. Patrick Rooney points out that the forty-year average for corporate pre-tax giving is 0.9 percent. The highs were 1.8 percent and 2 percent, in 1985 and 1986 respectively.
The high for pre-tax profit, by the way, was reached this year at 2.42 trillion dollars.—Ruth McCambridge