June 1, 2020; Vox
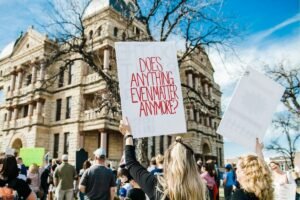
Although the mantra “what gets measured, gets managed” is something of a cliché, it’s relevant as we struggle with the latest killings of unarmed Black men by US police.
Australia keeps a tally of its civilian deaths by police officers—about five a year. So does the United Kingdom, with about three a year. But the United States, averaging 1,100 known civilian deaths each year by police officers, doesn’t.
“It’s ridiculous that I can’t tell you how many people were shot by the police in this country last week, last year, the last decade—it’s ridiculous,” admitted the FBI director James Comey in a speech in 2015.
That period, following the 2014 fatal shooting of Michael Brown in Ferguson and chokehold death of Eric Garner in New York City, could have been a watershed moment for police accountability and transparency. President Barack Obama created the Task Force on 21st Century Policing, whose report called for local law enforcement agencies to report to the federal government when their officers kill someone.
Two years later, the Federal Bureau of Investigation (FBI) piloted an online national database to track both fatal and non-fatal use of force by law enforcement. Finally, in January 2019, the agency unveiled its official National Use-of-Force Data Collection. Unlike much of the Unified Crime Reporting system, lethal police shooting data submission by the more than 18,000 police departments is voluntary, with only departments covering 40 percent of officers reporting, and there are no data yet available for outside review.
Given the government’s failure to act effectively, what do we know about how police officers exercise their right to use deadly force in this country—what criminologist Justin Nix calls “this awesome power” that “no other profession has”?
Fortunately, some newspapers, activists and researchers have launched their own ambitious data collection efforts. The Washington Post maintains what is widely considered to be the most complete database, mining local news reports, public records and social media. In 2015, it found that police officers shoot and kill around 1,000 civilians a year, or twice the number previously reported by the FBI.
Two small-scale private efforts, Fatal Encounters and Mapping Police Violence, have also taken on the task—gleaning information from other databases and painstakingly adding details gathered from obituaries, criminal-records databases, police reports, and social media.
Sign up for our free newsletters
Subscribe to NPQ's newsletters to have our top stories delivered directly to your inbox.
By signing up, you agree to our privacy policy and terms of use, and to receive messages from NPQ and our partners.
Fatal Encounters is largely the work of one man— D. Brian Burghart, a white, middle-aged past editor of a weekly newspaper in Reno who, driven by a reporter’s instinct, wanted to know “why a bunch of [cops] down by the Truckee River” had shot and killed the driver of a stolen car in 2012. But he never could find any answers.
Try as I might, I just can’t wrap my head around that idea. In the 21st century, the only reason this information would not be tracked, data-based and available to the public is because somebody somewhere decided Americans shouldn’t know how many people are killed by police and under what circumstances…But it is out there. Somebody just has to collect it.
Contrasting with Burghart, the founders of Mapping Police Violence (MPV), a self-described research collaborative, are young (ages 29–33) African American activists, former educators and policy advocates shaped by Ferguson, whose passion and focus is “to end policy violence and systemic racism in America.”
In a country where at least three people are killed by police every day, we need to know the full scale of police violence against our communities. The maps and charts on MPV’s site aim to provide us with the answers we need.
Researchers are digging into these databases, producing more than 50 papers so far. But methods and conclusions vary, particularly about the role of racial bias, and these national scale databases are messy with no agreed upon definition of the “use of force” as well as markedly varying police protocols and reporting requirements across the 18,000 local agencies. Still, some findings cannot be disputed:
- Despite years of demonstrations, advocacy and even policy change, police killings have been largely constant—2014 with 1,059 reported police killings was the lowest year of the past five; 2018 with 1,143 murders was the highest. But there’s no clear trend, either up or down.
- Ninety-nine percent of police killings from 2014–2019 did not result in charges, much less a conviction.
- Black people are nearly twice as likely to be killed by police as a Latinx person and nearly three times more likely to be killed than a white.
- Black people are also about 1.4 times more likely to be unarmed in fatal police interactions than whites and about 1.2 times more likely to be murdered unarmed than Latinxs.
Some findings raise more questions than answers:
- There is little connection between rates of violent crime and police killings at the big city level.
- Geography makes a difference, but not in obvious ways: A Black person was no more likely than a white person to be fatally shot by police in Mesa (AZ), Honolulu (HI), Lexington (KY) and Henderson (NV), but 46.7 times more likely in Santa Ana (CA). What does seem to matter is the degree of racial residential segregation. The more racially segregated a city, the greater the racial disparities in fatal police shootings.
- The racial composition of a police force had no impact on the prevalence of Black vs. white killings. Rather, “police organizations that have higher percentages of black officers are likely to have more police-involved homicides of Black citizens, until they reach a critical mass.” That critical mass is only reached when Black officers make up more than 40 percent of the police force.
But some policy interventions do seem to make a difference. Police departments that have adopted specific use of force policies kill significantly fewer people—but few police departments have adopted them:
- 25 percent decrease—when officers required to use all other means before shooting
- 25 percent decrease—when all uses of force are required to be reported
- 22 percent decrease—when chokeholds and strangleholds are banned
- 19 percent decrease—when department has a uses of force continuum
- 15 percent decrease—when de-escalation is required
And gun laws and gun ownership rates do seem to be associated with killings by police officers.
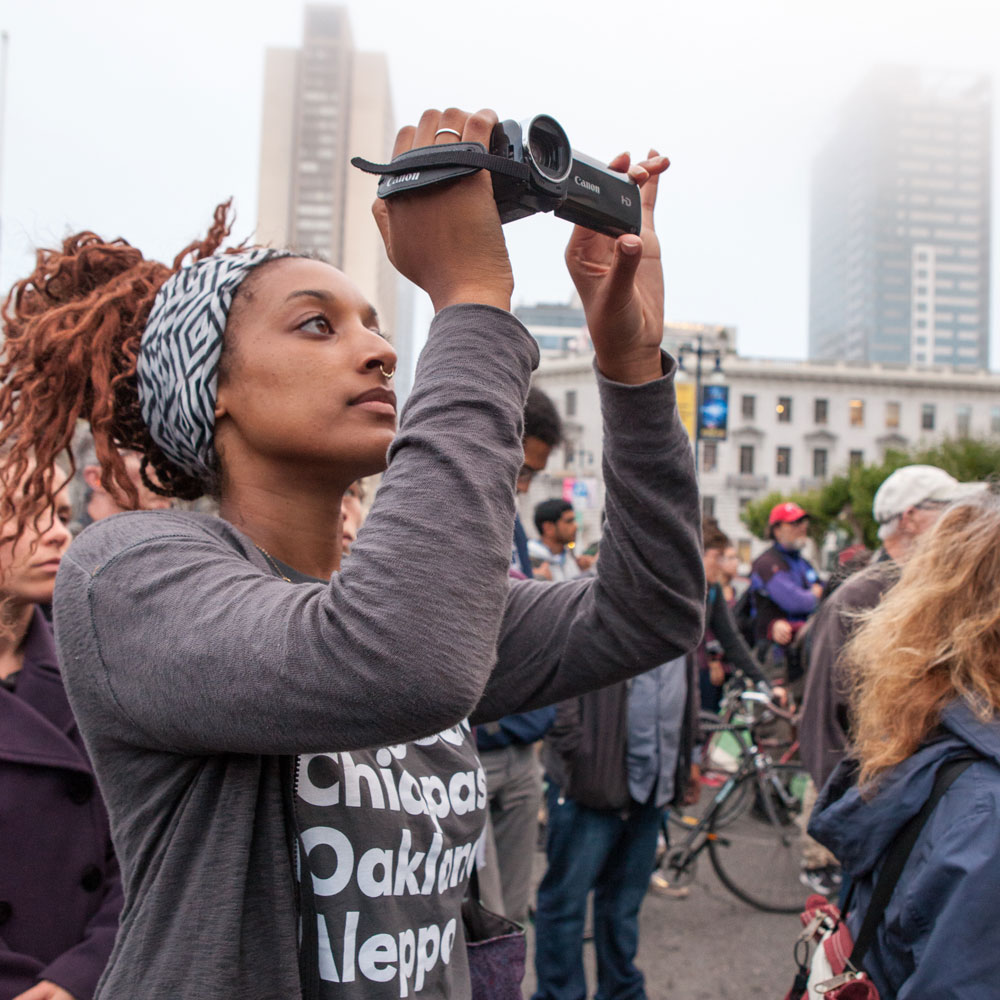
Independent journalism and research play a critical role in stepping up when government fails to provide a comprehensive national database of police use of lethal force. Whatever measures you use, the US criminal justice system is biased against Black Americans, and Black people are far more likely to be the subjects of state-sanctioned violence in the US compared to white citizens. But until the public firmly understands the enormity of this problem, the factors that make one department differ from another, and the policies that work and don’t work, we’ll still resort to the “bad apple” claim, when it’s the whole tree and the whole orchard that is sick.—Debby Warren