
April 23, 2013;Pew Research, “Social & Demographic Trends”
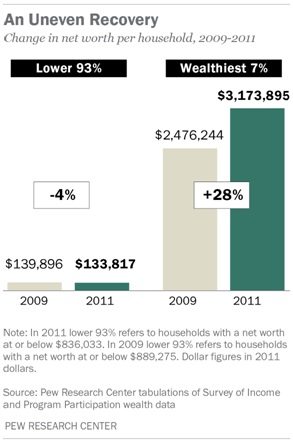
Between 2009 and 2011, the wealthiest 7% got wealthier by a big 28% and the rest of us got poorer by 4%. Let’s put it another way: The aggregate 8 million households in that top 7% saw their wealth rise by an estimated $5.6 trillion, while the 111 million households in the bottom group had their aggregate wealth fall by an estimated $600 billion. The wealth of America’s households over this period increased by $5 trillion, so there you go!
Sign up for our free newsletters
Subscribe to NPQ's newsletters to have our top stories delivered directly to your inbox.
By signing up, you agree to our privacy policy and terms of use, and to receive messages from NPQ and our partners.
Have you got it, yet? Okay, once more: imagine a pie chart of the economy. It used to be that the wealthiest top 7% would have control over 56% of the pie; now, they have 63%.
We will leave the rest of this report for you to read, but the next time you wonder why you aren’t feeling the recovery yet, remember the visual below and get busy on economic reform.
—Ruth McCambridge