In Austin, Texas, a diverse group of service providers, funders, and policy makers came together to improve adolescent health. They ran into a critical issue: the adolescent health system was so complex, multifaceted, and dynamic that it resisted traditional analytical approaches. This article explains how the group used a powerful technique called value network analysis to help them assess the system, generate new insights, and mobilize energy for change.
The Context: Adolescent Health in Austin
Austin, Texas is a vibrant city—the hub for artistic and musical expression in the state and one of the major live-music capitals of the world. It is also a city with challenges. Between 2006 and 2010, an estimated 21 percent of youth in Travis County were living in poverty.1 Other indicators of youth well-being in Austin were also alarming:
- Juvenile probation referrals were 65 per 1,000 in Travis County, compared with 43 per 1,000 for Texas as a whole.2
- The percentage of students dropping out in grades 7 through 12 was 3.3 percent in Travis County, compared with 2.7 percent for Texas.3
- 38 percent of middle school students and 32 percent of high school students reported that they had friends involved in gang activity.4
Motivated by the desire to make significant improvements in the lives of Travis County youth, the Austin/Travis County Health and Human Services Department (HHSD) formed the Austin Healthy Adolescent (AHA) Initiative (www.ahainitiative.org) in 2009. The hope was that the AHA Initiative would make positive change in the health of adolescents.
Led by Austin HHSD staffer Nikki Treviño and facilitated by Omega Point International consultant Stephanie Nestlerode, the multi-stakeholder AHA Initiative leadership group created their vision early on in their process. They seek a world in which adolescents are active decision makers and fully engage in improving their own health and the health of their communities. By casting adolescents as active decision makers, the leadership group set the tone for their work. It would no longer be service providers and policy experts making decisions for youth; instead, youth would be deeply involved every step of the way.
The Challenge
Leaders of the AHA Initiative knew that it was impossible to achieve their vision without understanding Austin’s adolescent health system. Stephanie Nestlerode, who began serving as process facilitator when the AHA Initiative first formed, explained that “there are so many involved in adolescent health. We kept getting overwhelmed by who was involved. We found it hard to find leverage points in the complex, messy system that is health services in Austin.”
Additionally, Stephanie says, “We had an inkling that parents, youth, and providers would look at things differently. Yet, services planning is very provider dominated. It is typically providers deciding what they’re going to provide to youth based on need indicators, without bringing youth directly into the planning process.” The AHA leadership group wanted to know how the different groups looked at health services and how well the current system served the needs of youth.
I was invited to bring network thinking to the AHA steering committee, and, in May 2011, I helped the AHA leadership group create an initial map of players in Austin’s adolescent health services system. The map included service providers, funders, schools, and other organizations. However, we were missing something critical: the youth. We needed to get their voices in the room and understand their perspectives. We decided to do this through value network analysis.
The Method: Value Network Analysis
| Some Basic Assumptions Underlying Value Network Analysis5 |
|
Value network analysis (VNA) was developed in the 1990s by Verna Allee, the founder of ValueNet Works. At the time, she felt that business process reengineering techniques missed the mark, since they assumed that the goal was to create a completely replicable, predictable process—which didn’t seem achievable in the messy reality of contemporary organizations. Allee wanted a technique that would show the dynamic nature of systems, the flow of activity through a system, and the role of people in that system. Through trial and error, Allee built VNA using what she knew about complexity and network sciences.
Like any network, value networks consist of nodes and flows. In this case, the nodes are roles—the actual contributing roles that participants play in the network. Examples of roles are Problem Solver, Sponsor, Designer, and Customer. Participant names are not used, since people are often transitory in organizations while roles remain more constant.
The flows in the value network are transactions: transfers of role-generated deliverables. Fees, reports, feedback, and services are all types of deliverables. Transactions can be tangible—mandated by the system—or intangible—representative of “extras” that people provide in order to help the system move more efficiently or effectively. For example, when sending a report to a client, the report is the tangible, mandated deliverable. The follow-up call to make sure the report was received is usually an “extra”—an intangible. It’s not mandated by the contract between consultant and client yet is helpful for maintaining trust and communication.
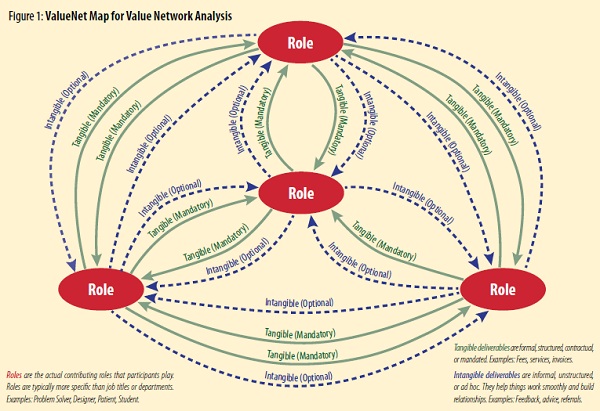
The ValueNet Map for value network analysis shows the template for an analysis (see figure 1, below). Ovals represent roles, which would be labeled according to the function they provide, such as Writer, Designer, or Customer. Lines represent transactions: deliverables that transfer from one role to another. The solid green lines represent tangible, mandated transactions, while the dotted blue lines represent intangible “extras.”

Actual value network maps have many more roles and transactions. Figure 1 simply shows the basic components and format of a value network.
The Process
Design. Since its inception, the AHA Initiative has been collaborative and participatory. Planning the VNA process was no different. In late 2011, the leadership group convened to decide on their approach to understanding youth’s and service providers’ perceptions of health services. VNA would help the group to understand the micro level of Austin’s adolescent health services system, and we would learn how services are actually delivered by service providers and received by adolescents. Once it was agreed that we would pursue the mapping initiative, the group chartered a team to guide the process. This team consisted of youth, service providers, and funders.
Over the course of several meetings, team members grappled with the important issues of scope and boundaries as well as definition of terms. What exactly did we mean by youth? What geographic area would be within our field of reference? And, most important, what did we mean by adolescent health services? After extensive discussion, the committee settled on some parameters for our work.
First, youth were defined as anyone between the ages of ten and twenty-two. Second, the scope was limited to Travis County, which included Austin and bordering communities of Round Rock, Bee Cave, and Pflugerville, among others. Third, the team also determined that we were interested in youth across all income brackets and risk groups, not just in lower-income families or high-risk groups. Fourth, the team came to agreement on what adolescent health services would mean for the purposes of our work together. Ostensibly, adolescent health services could include anything from routine annual physicals and broken limbs to sexually transmitted disease testing and prenatal care. Since considerable attention and resources in the community were already devoted to sexual health issues, the team took sexual health off the table for the mapping effort. Instead, we decided to focus on what youth had identified as most important in a series of focus groups conducted earlier in the year—under-the-radar issues that receive little organized energy or attention in Travis County:
- Alternatives to drugs and alcohol;
- Resistance to peer pressure;
- Nutrition; and
- Physical activity/exercise options and outlets.
With our definitional terms, scope, and boundaries identified, we were ready to map.
Discover. In early 2012, the AHA Initiative convened youth, policy makers, parents, and service providers for two sessions designed to map the current and ideal future adolescent health system. In the first session, held in February, we developed maps of the current state. We asked youth and service providers, in separate groups, to identify what they would do (or what they thought youth would do) in response to three scenarios developed by the planning team.
| The Three Scenarios |
| SCENARIO #1: A fourteen-year-old’s best friend from the neighborhood is getting seriously bullied. A group of girls are saying that she’s too fat to ever have a boyfriend. The friend says it’s no big deal, but some of the stuff is pretty harsh. She says that she is worried about her weight but her family has horrible eating patterns, she doesn’t know how to cook, and she has no money. How could she get help?
SCENARIO #2: A thirteen-year-old boy’s friends all boast that they’ve had sex. He doesn’t have a girlfriend and his friends are teasing him a lot about that. There’s no one he really likes right now, but he feels a lot of pressure to “hook up.” He wonders if something’s wrong with him. Shouldn’t he have a girlfriend already? How could he get help? SCENARIO #3: A seventeen-year-old girl has just been told by her friends that they’re going to quit hanging out with her. They say that she’s too unreliable and stands them up too often. They think the girl is drinking too much. In fact, at a recent party she passed out and couldn’t remember what happened. It seems like her life revolves around drinking these days (when to do it, how she’ll get it, etc.). She wonders if maybe she should talk to someone about what’s happening. How could she get help? |
Our first step was to confirm the roles involved in the scenarios. The team had brainstormed an initial list, which we refined as a group. One interesting outcome: the team had neglected to include a bully role, which was critical in the first scenario. Youth also added the role of authority figure for events at school.
Our second step was to identify what happened in each scenario. What would the person do who was being bullied, feeling peer pressure, or seeing his or her friend make bad choices about alcohol? We documented all of these transactions. We closed the meeting with a “show and discuss” session in which youth and service providers shared their maps with each other, answered questions, and expressed reactions to the maps.
Sign up for our free newsletters
Subscribe to NPQ's newsletters to have our top stories delivered directly to your inbox.
By signing up, you agree to our privacy policy and terms of use, and to receive messages from NPQ and our partners.
We held a second meeting, in March 2012, with the same group plus many additional participants (the buzz had been good, and more wanted to participate). In this meeting we reviewed the two maps via a series of skits in which mixed groups of youth and service providers showed the important things they had learned from the first meeting. Then, we created groups to examine each scenario individually and answer the following questions:
- In an ideal world, what would happen if this young person had this problem?
- What would you add, change, or delete from the youth map or the service provider map?
The Maps
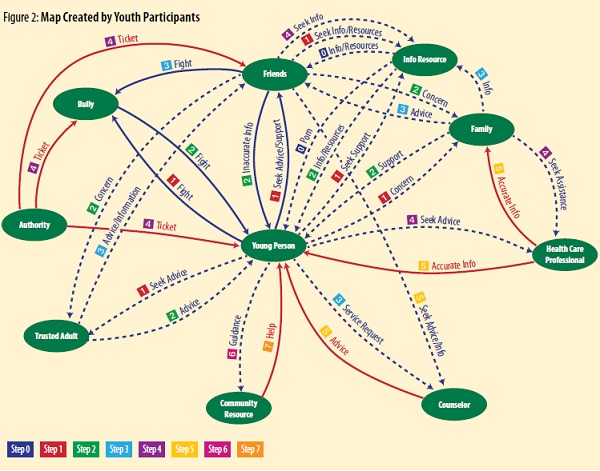
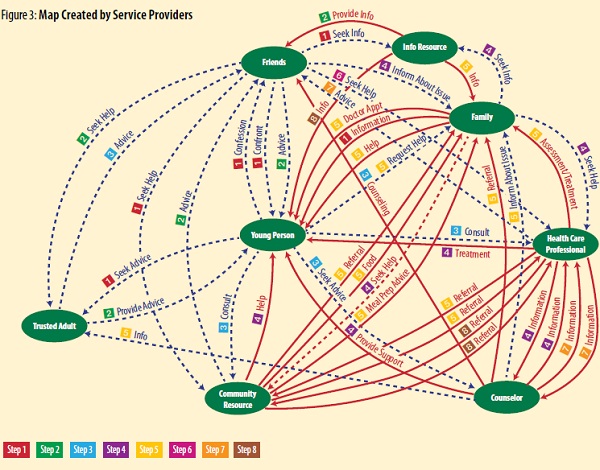
We left our first mapping meeting with two diagrams: one created by youth participants and the other created by service providers (see figures 2 and 3, below). In each, roles are laid out in similar positions. The Young Person is always in the center. Then, starting at twelve o’clock and proceeding clockwise, we find the other roles: Friends, Info Resource, Family, Health Care Professional, Counselor, Community Resource, and Trusted Adult. On the youth map, two additional roles are included: Authority and Bully.


Lines represent the interactions between roles. Normally, the tangible, mandated activities are solid red lines and the intangible “extras” are dotted blue lines. One interesting outcome of the youth mapping discussion was the addition of a third type of line, to represent activities that, while not formally mandated by the system, are, however, socially mandatory. Is going to friends first when you have a problem mandated by the Austin adolescent health system? No. But it is social suicide to circumvent friends, according to the youth mappers. These kinds of socially mandatory activities are marked solid blue.
Numbers show the sequence of activity, or steps. If you look at the youth map, you’ll see that a number of actions can happen almost simultaneously: that’s why they all have the same number label. For example, the Young Person goes to Friends to Seek Advice/Support (1), a Trusted Adult to Seek Advice (1), the Info Resource (Internet) to Seek Support (1), and to the Family to express Concern (1). In the bullying scenario, they’ll also go immediately to the Bully to Fight (1). Some of the actions/steps in this particular group are considered mandatory (represented by solid blue lines) by the youth. Not fighting, for instance, would have been socially self-destructive.
There’s another unusual activity on the youth map: Porn. When sequencing activities, the youth assigned Porn the number zero because, they said, young people explore sex online all the time and before they have any sexual-health-related issue. We had encouraged youth to be real: we wanted to hear the true story of what happened in their world. Their willingness to include porn was an early indication that they were taking risks and putting the unblemished truth on their maps.
What We Learned
We learned a tremendous amount from our mapping initiative. A few of our most significant realizations related to different worldviews, the importance of trusted adults, the challenge of authority, and the challenge of immediacy.
Different Worldviews. A quick look at the two maps side by side shows that service providers and youth see the world quite differently. Service providers see much more activity between the healthcare professional, counselor, and community activist (in the three o’clock, five o’clock, and six-thirty locations on the maps). In comparison, the lower-right-hand corner of the youth map is positively sparse; there are very few interactions between service providers.
This gave us our first insight: service providers’ view focuses on service provider activities, not youth activities. The providers’ time is dominated by mandated coordination between roles (represented by solid red lines). Amid all of those mandated activities, they provide only three sources of assistance to the young person: treatment from the Health Care Professional, support from the Counselor, and help from the Community Resource. In retrospect, it seems perfectly reasonable that service providers would be consumed by mandatory coordination activities. However, it was genuinely surprising to service providers in the room that their view of the world was so very different from the youth’s view.
The Importance of Trusted Adults. When we look at the youth map, we see that most of the live interactions are between the Young Person, Friends, and Trusted Adult (the Info Resource, which is involved in many activities, represents the web and, therefore, isn’t live). According to our youth mappers, young people always go first to their friends, since, socially, it is taboo to circumvent them. However, friends often give inaccurate advice, which our mappers knew and represented on their maps (see the solid blue line labeled “Inaccurate Info” going from Friends to Young Person).
It soon became clear that the Trusted Adult was a critical figure in youth’s process of solving health-related challenges. This is the person who gives accurate advice, listens compassionately, helps young people think through their options, and asks helpful questions. The trust between the adult and the youth is significant and fragile. We learned that most adults in young people’s lives aren’t trusted; they have too often broken confidences. Instead, young people go to someone just a little bit older—often an older sibling or other family member—who is not part of the formal adolescent health system.
We identified the Trusted Adult as the “heartbeat” of the system. Without a trusted adult, youth potentially have no direct resource that can provide accurate information and help them determine a course of action. Youth without trusted adults suffer, since they are forced to rely on inaccurate information from friends and on online information (the Info Resource).
The Challenge of Authority . One of the most startling discoveries related to the interactions between youth and authority figures was that many youth have their first contact with a non-family authority figure when a school principal or security officer writes them a “ticket.” This is something that happens commonly in Austin schools: any infraction of school rules is punished with a ticket requiring offenders to pay a fine or perform community service. If they don’t pay, or if they collect a certain number of tickets, they are suspended. The zero-tolerance bullying policy includes not just the bullying but self-defense against bullying, too. As a result, all young people involved have incentives to stay away from authority figures lest they get punished.
Youth didn’t want their first contact with authority to be punitive. According to our mappers, young people reach out to the Counselor for support in action/step 3 and to the Health Care Professional for advice in action/step 4. Neither provides a response until action/step 5. By that time, the Young Person has already initiated a fight, the Bully has fought back, the Friends have escalated the fight by getting involved, and the Authority has punished them all with tickets.
This realization was alarming for many service providers in the room. After some initial defensiveness (“I would never betray a confidence”), they began to see what was happening. Service providers realized that the actions of some had negative impacts on their entire group. Despite their reluctance to admit that betrayals occurred, they had stories of colleagues who had shared something that was supposed to be confidential. Of course, adults are required to report certain things. However, there were also frequent misunderstandings between youth and service providers about what would be held confidential. A youth might say, “I really feel like hurting him,” which might alarm a provider into sharing the confidence, when the youth was just blowing off steam and had no intention of actually doing damage. Or a provider might pull in a principal or parent when the youth really wanted to keep the matter contained. Then youth form the impression that they can’t trust adults to keep confidences.
The Challenge of Immediacy. Another challenge we identified is the issue of immediacy. When in a difficult situation, a Young Person often feels as though he or she can’t wait to get help. The youth will reach out extensively—to Friends, a Trusted Adult, Family, a Health Care Professional, and a Counselor. He or she will look up information online. The most immediate support comes from Friends, the Trusted Adult, Family, and the Internet. Getting formal support services takes a long time. As one youth said, “You feel like crap while services are figuring out resources.” Instead, youth take action.
The Future
During our second session, we spent considerable time talking about how to handle these issues—different worldviews, importance of trusted adults, and the challenge of authority, among others. Several priorities emerged from our conversation. These priorities are now Infoinforming decisions about action by the AHA Initiative. They are:
- Building trust between service providers and youth. The AHA Initiative is sponsoring workshops and leading conference sessions to help service providers learn how to build trusted relationships with youth.
- Placing youth at the center of healthcare service decisions. The AHA Initiative is working to develop a method for helping healthcare organizations involve adolescents thoughtfully in policy and program decisions that affect them. The Initiative is continuing education for service providers to help them understand what the world looks like to adolescents and how the best intentions of service organizations can sometimes go awry.
- Fleshing out the maps. The youth involved in the mapping sessions represent a small subsection of Travis County youth. To help ensure the maps are valid across socioeconomic, geographic, school, and personality differences, the AHA Initiative is engaging more youth in validating them.
- Use of technology. The conversations reinforced the leadership group’s suspicion that youth rely more on technology than service providers realize. With the help of a youth technology organization, the AHA Initiative is working on programs such as a text-based Q&A service for sexual health questions and an alternative to Facebook for young people.
Conclusion
This article is just a peek into the beginning stages of our use of value network analysis to tease out priorities for the future work of the AHA Initiative. While the VNA didn’t solve the problem—Austin’s adolescent health system is too complex for that—it did help us focus and mobilize energy, quickly and easily brought a diverse group of stakeholders together, created clarity about how a deeply complex system operates, surfaced the differences in perspective that are meaningful, and helped stakeholders converge on agreement about priorities. And it did what we most needed it to do: give us the big picture of how youth and service providers experience the system. Other VNA applications, unlike ours, have resulted in immediate solutions. For example, the Mayo Clinic used VNA to shorten a process from three and one-half months to four weeks.6 While we don’t have concrete solutions to share yet, we offer this methodology in the hope that others can learn from our experience and benefit from VNA.
Notes
- U.S. Census Bureau, 2006–2010 American Community Survey 5-Year Estimates: Travis County, retrieved September 27, 2012, factfinder2.census.gov/faces/nav/jsf/pages/index.xhtml.
- Texas Juvenile Probation Commission, The State of Juvenile Probation Activity in Texas: Calendar Year 2006, no. RPT-STAT-2006 (Austin, TX: Texas Juvenile Probation Commission, 2007), 35, www.tjjd.texas.gov/publications/reports/RPTSTAT2006.pdf.
- Texas Education Agency: Division of Accountability Research Department of Assessment, Accountability, and Data Quality, Secondary School Completion and Dropouts in Texas Public Schools, 2006–07: County Supplement, no. GE08 601 06 (Austin, TX: Texas Education Agency, 2008), www.tea.state.tx.us/acctres/DropComp _cnty_supp_06-07.pdf; ibid.
- Austin Independent School District, Results of the 2008 Student Substance Use and Safety Survey: Ann Richards Middle School, no. 07.87 (Austin, TX: Austin Independent School District, 2009), 9, archive.austinisd.org/inside/docs/ope_2007-2008 _Student_Substance_Use_MS.pdf; Austin Independent School District, Results of the 2008 Student Substance Use and Safety Survey: Austin High School (Austin, TX: Austin Independent School District, 2009), archive .austinisd.org/inside/docs/ope _2007-2008 _Student _Substance _Use _HS.pdf. Accessed 9/27/2012.
- Verna Allee and Oliver Schwabe, “Deep Dive into the Methodology,” chap. 7 in Value Networks and the True Nature of Collaboration (California: ValueNet Works and Verna Allee Associates, 2011), www.valuenetworksandcollaboration.com/deepdive.html.
- Allee and Schwabe, “Selected Case Studies: Procedure Scheduling in Healthcare,” chap. 6 in Value Networks and the True Nature of Collaboration (California: ValueNet Works and Verna Allee Associates, 2011), www.valuenetworksandcollaboration.com/cases/procedurescheduling.html.
http://www.dev-npq-site.pantheonsite.io/policysocial-context/21264-a-scoop-of-social-responsibility-ben-and-jerrys-the-b-corp.html


