April 22, 2015; M+R Strategic Services
The 2015 M+R Benchmark Study is out, and this year, M+R surveyed eighty-four nonprofit organizations on their fundraising metrics through social media, email marketing, and online revenue. While it is an admittedly small sample, the findings are detailed enough to warrant a look.
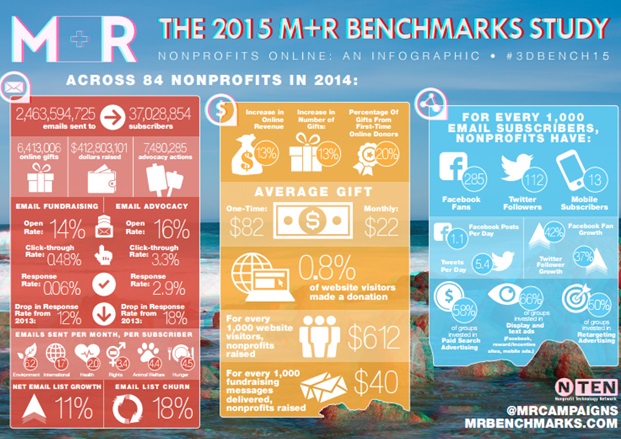
So what’s new this year? Social media is still growing, email list size is increasing but that growth is sluggish compared to previous years, and monthly giving has increased in popularity. NTEN and M+R have published an infographic that gives a peek at overall statistics, and NPQ will dive further into the metrics in this study below to get a sense of what these numbers mean:

M+R has also provided a handy tool this year that allows organization to create their own infographic by entering their organization’s fundraising metrics and comparing them to the nonprofits in this year’s study.
Email Metrics: Nonprofits saw an email list size growth of eleven percent in 2014, which shows organizations are still growing their email audiences, but at a much slower rate than the two previous years. Open rates were also up across advocacy and fundraising messaging for an overall increase of four percent. Click-through rates for fundraising messages were up slightly as well at 0.48%, but this overall increase in open rate and click-through rate could be linked to the fact that many organizations are now suppressing email lists. At NTEN’s Nonprofit Technology Conference, M+R shared that approximately 47% of participating nonprofits have suppressed inactive contacts in the last year. By suppressing inactive contacts, list growth may be slower, but nonprofits are seeing the value in creating healthy lists with much higher open and click-through rates.
Social Media Metrics: Social media audiences are still much smaller than email list sizes, but surveyed nonprofits found that social networks grew much faster than email audiences in 2014. Even though we may not see donations directly coming from social media, it’s where your supporters lie and one of the most useful ways to get important information to your online audience.
Sign up for our free newsletters
Subscribe to NPQ's newsletters to have our top stories delivered directly to your inbox.
By signing up, you agree to our privacy policy and terms of use, and to receive messages from NPQ and our partners.
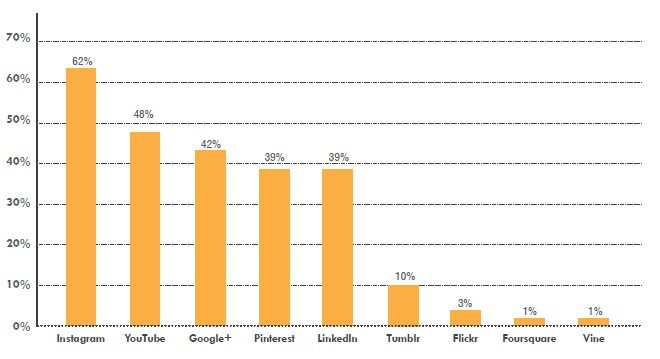
When it comes to nonprofits reaching supporters on social media, it’s without question that Twitter and Facebook are on top. Facebook fans outperformed Twitter followers in every sector that has established a presence on both platforms. M+R also surveyed participants and asked what their nonprofit feels is most important to their organization after the “Big Two” social networks. The results were interesting and spanned across many different networks:

Instagram stood out above all other social platforms with sixty-two percent of surveyed nonprofits favoring this network, followed closely by YouTube and then Google+, Pinterest and LinkedIn. LinkedIn and Google+ were highly valued by nonprofits in previous years, but these metrics show many nonprofits are expanding their social media strategies to seek out younger audiences in new spaces.
Online Giving Metrics: The monthly giving structure has really taken off within the studied group of nonprofits. Monthly donors are now accounting for more online revenue than ever before. Online monthly giving expanded by thirty-two percent in 2014, compared to nine percent for one-time giving. Factors that could be driving this trend are nonprofits actively recruiting monthly givers and donors showing more interest in donating on a consistent basis. Nonprofits that are still focusing a majority of their fundraising strategies on end-of-year giving may want to avoid putting their eggs in one basket and also focus on highlighting the benefits of monthly giving for donors on donation pages.
Website traffic grew by eleven percent this year and M+R witnessed a slight 0.5% drop in the median website conversion rate year over year, which was 0.76% in 2014. Overall, online revenue increased by thirteen percent in 2014, and environmental, health, and rights groups saw the largest growth. International groups saw an eighteen percent drop in online revenue, which could be attributed to a surge of donations received during Typhoon Haiyan in 2013. Organizations raised $0.61 per website visitor, which is down considerably by almost twelve percent from 2013. A rise in mobile technology could be related to this significant drop, where mobile users may be less inclined to click, take action, and give through a traditional donation page (concluded from M+R’s 2012 study). Thirteen percent of website visitors to these organizations’ donation page actually completed a gift.
This was the first year M+R included cultural organizations as a sector, which revealed some interesting data surrounding these groups. Cultural sector organizations raised $141 per 1,000 fundraising messages sent, which is a significant difference from the $40 average. Cultural groups also stood out with the highest email open rates (20%) of any sector. Many arts and cultural organizations are membership-based, which could establish a more intimate relationship with donors and contribute to these higher metrics. The study concluded, “Cultural groups appear to be forming some sort of counter-culture of online fundraising performance, rebelling against overall industry trends.”—Aine Creedon


