March 3, 2020; Chronicle of Higher Education
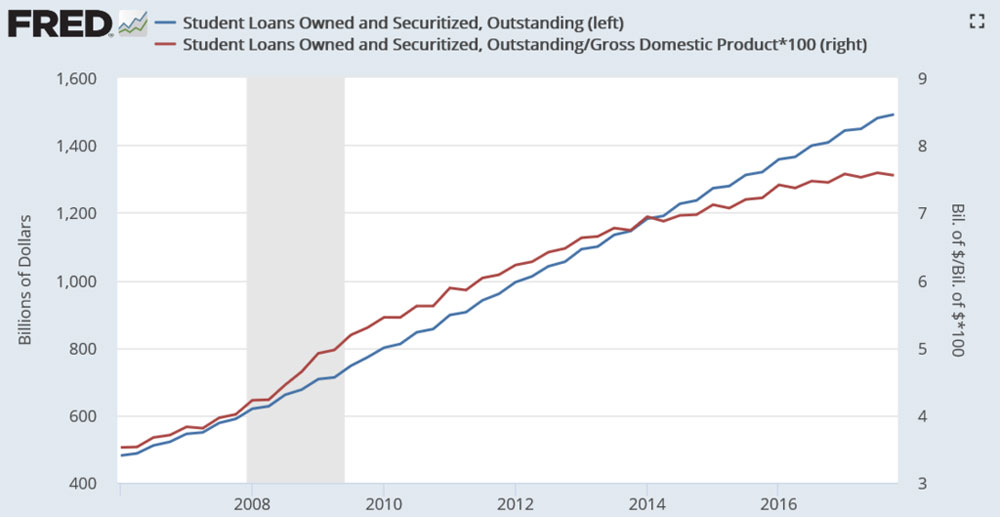
As NPQ has covered, the menace of the student debt monster continues to mount. Now the Chronicle of Higher Education has produced an interactive piece on student borrower data with charts, bar graphs, and illustrative graphics. Among other things, it shows that student loan debt increases by $250,000 nationally every two minutes. Indeed, as recently as 2003, total student loan debt was $250 billion, less than one-sixth its current level.
The numbers are jarring. Forty-five million individuals hold student debt, an increase of over 16 million people in ten years. Just for perspective, 45 million is more people than the number who reside in the Mid-Atlantic states of New York, New Jersey and Pennsylvania combined. The student debt load for the whole nation totals $1.51 trillion. And, according to the Federal Reserve Board’s triennial survey of household economics and decision-making, one-in-three student loan borrowers report that they are “finding it difficult to get by” or “just getting by.”
The portrait is not cut and dried. There are a lot of variables among the student borrowers. For instance, these students are not all young and inexperienced, straight from high school, or too naïve to understand the scope of the debt when they signed their name. At least half are over 30, and 20 percent are over 40. These individuals are working and often have children; they came to school with responsibilities and the accompanying bills to pay before even taking on student debt. These older students are one reason that over 94 percent of students hold their own loans; students’ parents have very little of that debt.
Sixty percent of those holding student debt have an undergraduate degree, and 61 percent of the total are women. More than 50 percent of borrowers are white, 19 percent are Black, and 17 percent are Latinx.
Sign up for our free newsletters
Subscribe to NPQ's newsletters to have our top stories delivered directly to your inbox.
By signing up, you agree to our privacy policy and terms of use, and to receive messages from NPQ and our partners.
Students who attend public colleges and universities have the highest share of loan debt, but private nonprofit institutions result in more debt per individual. The students who attend for-profit colleges have the lowest mean debt of $20,869, but most of the federal student direct loans are more than $60,000. The reported income on the FAFSA (Free Application for Federal Student Aid) is $30,000 or less for almost half of those holding federal student loans.
With 45 million student borrowers, it isn’t surprising that many are late on making payments. And it isn’t always an enormous amount of money that drives borrowers to default—one in five of those 270 days delinquent owe less than $5,000. Whether another expense becomes more important, like the need to replace a car, or simple borrowers’ fatigue, at some point, millions of borrowers stop paying.
The archetypal person burdened with student debt is likely to be over 30 and making $30,000 or less. That doesn’t show the whole picture, though, since 70 percent of those in that income bracket are in default. On top of that, 31 percent of those who hold student debt did not finish; they do not have a degree. That is almost 20 million people who are “paying a mortgage on an invisible house”—doling out hard-earned dollars for something that cannot be used. One out of ten borrowers were in default as of the end of 2017. Those who have no degree are more than twice as likely to be 90 days or more in default than those who do have degrees.
Institutions of higher learning are well aware that only about 58 percent of students complete their degrees. They are trying various incentives to get students across the finish line, but in the meantime, those students are left with debt. While they surely have learned a great deal in their time at school, the degree is what employers look for. Those individuals must keep paying that debt down with no relief. And the number of dollars and students in debt keeps going up, becoming part of colorful bar charts, but with their life options diminished just the same.—Marian Conway