
Editors’ note: This article is from NPQ’s summer 2015 edition, “Nimble Nonprofits: The Land of the Frugal Visionary.” It was first published online on August 6, 2015.
Nonprofits take on debt (i.e., borrow) in the short term to cover temporarily inadequate cash flow and in the long term to finance capital expenditures that they expect to recover in the course of doing business.1 Capital expenditures naturally carry an element of risk. That chicken came home to roost for many arts organizations during the Great Recession, when even the most carefully made projections encountered a perfect storm of waning revenue sources. (Arts organizations, of course, gamble fairly regularly on the staging costs of a production or a new or improved performance space. Their financial analysis may beautifully justify the gamble—but, as they say, man plans and God laughs.)
Nonprofits have as many opportunities as anyone else to make fatal or at least seriously hobbling errors when it comes to the details of debt transactions and the projections on which they are based. The New York Times reported (for instance) that Cooper Union in New York City “borrowed $175 million for 30 years at a rate of 5.75 percent and then spent most of the proceeds on a lavish new building while continuing to run operating deficits. It also agreed to a prohibitively expensive prepayment penalty, making it financially impossible to extricate itself from the terms of the loan.”2
Although nonprofits are urged on to greater heights of entrepreneurial behavior, when it comes to borrowing they are not risking their own assets but the public’s, so they have a special obligation to gauge risk, limit it, and get the very best terms possible for any endeavor.
Short-Term Debt (and Its Long-Term Headaches)
Many nonprofits maintain a line of credit (LOC) with a local bank that enables them to pay their bills during months when cash flow is negative. The risks associated with this kind of borrowing are simple. In a tumultuous revenue environment, nonprofits may not be in a position to pay off a line of credit within the parameters of the contract, which may cause the loan to be converted to long-term debt. Repayment becomes a new and constant drain on net cash flow that is over and above operating costs. It shrinks an organization’s future options for programming and financing.
An implicit method of borrowing that costs nonprofits dearly is past-due trade debt. It is customary for vendors to give buyers thirty days to pay. After this point, a debt becomes past due and the buyer must pay a late charge or lose a prompt-payment discount. In effect, a delinquent buyer is implicitly “borrowing” from a vendor, making the vendor an unwilling lender. Unwilling lenders charge punitive fees, similar to a standard credit card interest rate of 1.5 percent per month, or 18 percent per year. Although past-due fees are equivalent to interest, they may be buried in the payment for goods and services in their annual filings with the Internal Revenue Service.
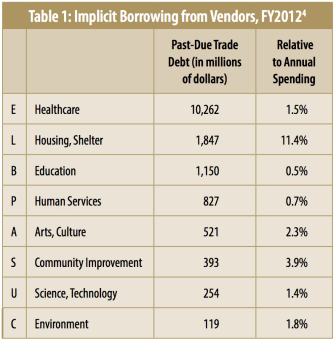
Table 1 shows the subsectors that borrow most heavily from their vendors. The first column is the National Taxonomy of Exempt Entities (NTEE) code.3 The aggregate amount of past-due trade debt is $16 billion (including lesser amounts not shown), or 1.3 percent of total nonprofit spending. Healthcare institutions alone owe $10 billion, but other subsectors have higher percentages of trade debt relative to their spending. Assuming that the average interest rate on past-due amounts is similar to a standard credit card rate, nonprofits pay vendors interest-like fees of $250 million per month, or $3 billion a year. My best guess is that at least half is profit to the vendor.
Nonprofits as Lenders of Short-Term Debt
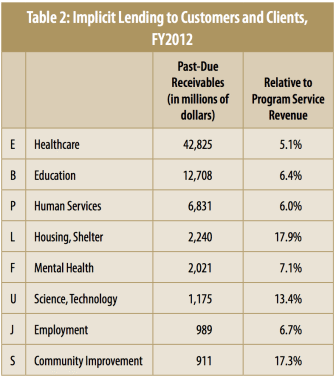
Anecdotes abound of buyers—governments in particular—being delinquent on their commitments. Nonprofits holding past-due receivables play the role of unwilling lender. Table 2 shows estimated receivables that are over thirty days past due to subsectors that account for over 90 percent of all implicit “lending” to customers and clients. The total for the nonprofit sector is $75 billion, or 5.8 percent of total program service revenue. Once again, healthcare institutions lead the list.
Long-Term Debt
There are two ways to pay for capital projects—gifts and borrowing. Many nonprofits will mix these, raising as much as they can in charitable gifts and borrowing the rest. Borrowing is seductive because it raises cash quickly and easily—unlike fundraising. But gifts have the benefit of not having to be repaid. Borrowing, on the other hand, increases long-term debt, which carries significant risk since it saddles an organization with an increased and constant drain on net cash flow for many years. Also, assets used as collateral become forfeit in case of default.
Financing capital projects is a complex balancing act of blending equity and debt. The economics of every project is different, and each must be evaluated on its own merits. Estimates of fundraising and borrowing capacities should be realistic; it should be unnecessary to stress this point, but the following cautionary tale suggests otherwise.
When the Field Museum of Natural History in Chicago raised less money than the project budget required, it borrowed. The result was a crisis in its operating budget that forced the museum to cut deeply into its research program.5 In response to cost overruns, organizers of the new August Wilson Center for African American Culture in Pittsburgh borrowed $11.2 million. The center defaulted, and its creditors now have possession of the property.6
Sign up for our free newsletters
Subscribe to NPQ's newsletters to have our top stories delivered directly to your inbox.
By signing up, you agree to our privacy policy and terms of use, and to receive messages from NPQ and our partners.
During a project’s concept/preplanning phase, an organization should assess its capacity to fundraise and to borrow. Financing decisions determine the scale of a project, which is not easily changed after work commences. A project’s budget should utilize as much equity as possible to minimize borrowing. As a general rule, 10 percent of donors contribute 90 percent of the resources (counting pledges) to a capital campaign. Before an organization decides on the scale of a project, it should canvass a large sample of the most generous 10 percent of likely donors to determine the depth of philanthropic support. The period of time when leadership gifts are lined up is called the “quiet phase” of a capital campaign.
How Big Is the Nonprofit Sector’s Debt?
My calculations, based on data on individual tax-exempt nonprofits obtained from the Core Files of the National Center for Charitable Statistics (NCCS)—for organizations’ fiscal years ending in 2012—show nonprofits owing $195 billion on commercial mortgages and $362 billion on tax-exempt bonds, totaling $557 billion. Other sources, like the Federal Reserve, show nonprofits owing $199 billion on commercial mortgages and $241 billion on tax-exempt bonds, totaling $440 billion.7 Differences between sources may be explained by sampling error, because far less than half of nonprofits have such long-term debts. It seems safe to assume that the total long-term debt of the nonprofit sector lies between $440 and $550 billion.
Nonprofits spend over $20 billion a year on interest. The bulk of this is due to mortgages and tax-exempt bonds, but the number also includes interest paid on lines of credit (LOCs) used for short-term borrowing. I calculate that interest paid relative to the amount of mortgages and tax-exempt bonds outstanding is 3.7 percent. To put this number in perspective, the average rate on thirty-year AAA tax-exempt bonds is 3.0 percent, and mortgage rates are usually higher.8
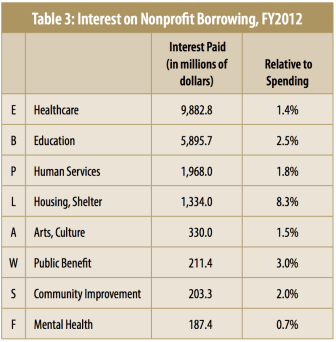
As one might guess, universities and hospitals borrow more funds and pay more interest than other nonprofits. Table 3 shows how much interest various subsectors paid in the fiscal year ending in 2012, which, according to my calculations, accounts for 97 percent of all interest paid by nonprofits. Although $20 billion is a large number, it is modest compared to total spending of the nonprofit sector. (Spending is defined here as expenses minus depreciation.)
The last column of Table 3 shows the amount of interest paid within a subsector divided by the amount of spending in the same subsector, expressed as a percent. Although healthcare and education institutions spend much more on interest than other subsectors, it is a smaller fraction of their spending in general. Nonprofit housing corporations are a contrasting case. They spend far less than education and healthcare institutions, but borrowing is a very important means of financing real estate, so interest is a significant fraction of spending on nonprofit housing.
It is difficult to say how much profit the for-profit sector earns from lending to the nonprofit sector, because there are substantial costs associated with lending. The largest portion is what economists call “opportunity cost,” which is the amount a lender could have earned on the most attractive alternative—namely, the value of the best lost opportunity. If lenders did not buy non-profits’ bonds, they could buy other tax-exempt bonds issued by state and local governments instead. Thus, the interest rate on these other investments is the lost opportunity of lending to nonprofits. My best guess of the profit margin on loans to nonprofits is 20 to 40 percent, which translates into $4 to $8 billion. To put these numbers in perspective, I estimate contemporaneous spending to have been $1,250 billion.
Is the nonprofit sector overextended with debt? Table 4 compares long-term borrowing of nonprofits and nonfinancial, noncorporate businesses. The latter group is used for comparison because it is closer in size to the nonprofit sector than the much larger corporate sector is.
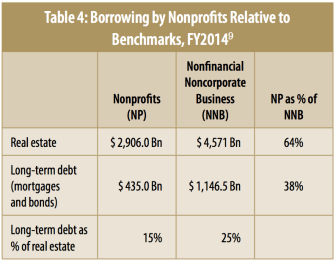
Given that long-term debt is a very important means of real-estate financing, the table shows the amount of real estate owned by both sectors. Although nonprofits own 64 percent as much real estate as nonfinancial, noncorporate businesses, they have only 38 percent as much long-term debt. Moreover, nonprofit long-term debt is only 15 percent of the value of its real estate, but the amount of debt owed by nonfinancial noncorporate businesses is 25 percent of the value of their real estate. Either nonprofits as a group are not as eager to borrow as for-profit businesses or they are financially weaker and less able to borrow.
All of this information points to a fairly conservative and judicious use of debt by the nonprofit sector, which makes sense since this sector does have the unique ability to use gifts to constitute capital instead of debt. However, there is substantial variation in indebtedness among nonprofits. As the anecdotes related in this article suggest, some nonprofits are dangerously overextended. At the top of a list of “10 Ways to Kill Your Nonprofit,” recently published in the Nonprofit Quarterly, is “overwhelm it with liabilities [debt].”10 In many cases, fixed costs related to debt will stick around longer than the board members who voted for the deal in the first place.
Notes
- “Nonprofits” as used throughout this article refer to operating public charities—that is, 501(c)(3) tax-exempt entities other than private foundations.
- James B. Stewart, “Cooper Union Inquiry Puts Nonprofits on Notice,” New York Times, April 9, 2015.
- Content in tables 1 through 3 was derived by the author from National Center for Charitable Statistics (NCCS) 2011 Core Files on individual tax-exempt nonprofits (proprietary data). The NCCS gathers the data from Form 990 informational returns that tax-exempt nonprofits file annually with the U.S. Internal Revenue Service. These estimates were calculated by the author from data on individual nonprofits contained in the NCCS Core File for 2011 (fiscal year 2012), but only those nonprofits that follow generally accepted accounting principles (GAAP). Given that mortgage lenders and bond underwriters almost always demand to see a borrower’s audited financial statements, based on GAAP these figures capture nearly all long-term debts of the nonprofit sector.
- “National Taxonomy of Exempt Entities,” National Center for Charitable Statistics (NCCS), accessed April 16, 2015.
- Heather Gillers and Jason Grotto, “Dinosaur-size debt,” Chicago Tribune, March 8, 2013.
- Elizabeth Bloom, “The rise and fall of the August Wilson Center,” Pittsburgh Post-Gazette, February 8, 2014.
- Data are from Z.1 Financial Accounts of the United States: Flow of Funds, Balance Sheets, and Integrated Macroeconomic Accounts, Fourth Quarter 2014, Federal Reserve Statistical Release (Washington, D.C.: Board of Governors of the Federal Reserve System, 2014), 133, table B.101.
- The rate is from “US Municipal Bonds,” Bloomberg Business, accessed April 16, 2015. Rates on AAA tax-exempt bonds issued before the beginning the Federal Reserve’s interest rate reduction program (Quantitative Easing) were at least 1.0 percent higher and are likely to return to that level when the Federal Reserve allows interest rates to reach normal market levels.
- Data are from Z.1 Financial Accounts of the United States, 79, 133, and 135, tables L.103, B.101, and B.104.
- Mark A. Hager and Elizabeth A. M. Searing, “10 Ways to Kill Your Nonprofit,” Nonprofit Quarterly (Winter 2014): 66–72.


