September 17, 2014; RT.com
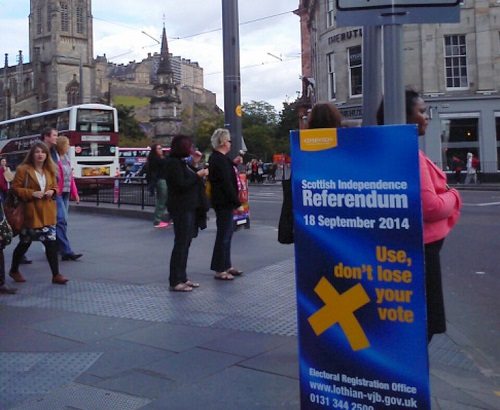
Users of social media in the campaign for Scotland’s independence have been very active, and those who would vote “yes” for independence have been far more active than those who oppose it. Research indicates that there were around 275,000 interactions each day related to the referendum over a five-week period, and a large majority of them were from Scots.
As for the differences, one example is that although polls suggest that the vote will be very close, the official “No” campaign page has 207,033 Facebook “likes,” compared to the “Yes” campaign’s 300,000.
RT.com analyzed samples of Twitter users to see if any recognizable differences in patterns of use could be discerned. A simple spreadsheet did indeed reveal some differences of use between the “Yes” and “No” camps. Below is a graph portraying the interaction patterns in the “Yes” camp:
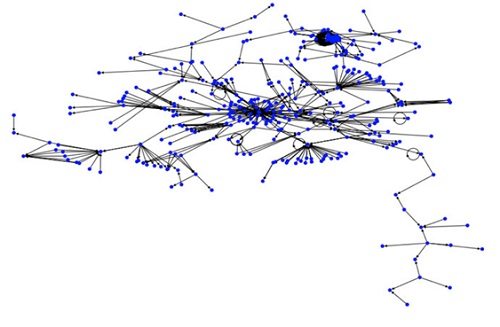
Twitter visualization showing networks of users using #VoteYes hashtag.
Sign up for our free newsletters
Subscribe to NPQ's newsletters to have our top stories delivered directly to your inbox.
By signing up, you agree to our privacy policy and terms of use, and to receive messages from NPQ and our partners.
RT.com writes, “When we entered #VoteYes into our program, we found that a huge number of users in our sample were engaging with each other, represented by the blue dots. Various ‘clusters’ of users represent high activity of people using the hashtag, while the large number of connections between the central clusters and users outside them ultimately show that the ‘Yes’ message is not only being tweeted more often, but users that tweet with the hashtag also frequently engage with others on social media.”
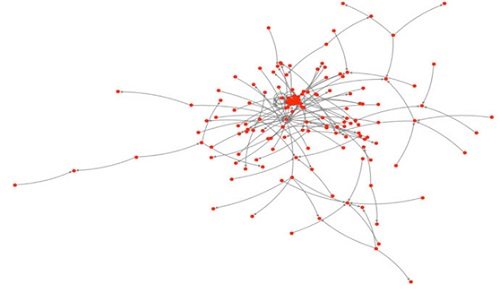
Twitter visualization showing networks using #VoteNo hashtag
On the other hand, those using the hashtag #VoteNo were less likely to share other content on Twitter or to retweet messages containing the hashtag.
While it is not clear that social media will deeply affect the outcome of the election today, according to the report, it has had a part in shaping the debate.—Ruth McCambridge


