
It’s not hard to get people excited by the idea of big numbers in social media. Nonprofits are notorious penny-pinchers, and if Twitter can deliver huge numbers without hard costs (which is to say, non-personnel cash out the door), then many nonprofits go out in search of the big numbers.
Understanding the impact of Twitter and other social platforms has evolved from just seeing a follower count to really understanding the impact of what those followers can do to support a nonprofit mission. It may at first have seemed that just having a large number of followers was helpful, but as better measurement tools came into place, it’s now possible to measure how many of those followers actually see a message (the reach) and how many of them then do something as a result (the response).
Sign up for our free newsletters
Subscribe to NPQ's newsletters to have our top stories delivered directly to your inbox.
By signing up, you agree to our privacy policy and terms of use, and to receive messages from NPQ and our partners.
Nonprofit Quarterly has been writing about better measurement of social media for years, but mostly lamenting the need for a better tool than a Klout score. Nonprofits need to know not just retweets and total reach of retweets (which services like SumAll do) but which of those followers are getting actions from their followers. Which accounts are real influencers, getting people to click through to make donations and join advocacy campaigns, and which are just tweeting into a very large but inactive group?
The Social Media Research Foundation thinks they’ve built a better mousetrap with NodeXL. The tool is an Excel plug-in, accessible to nearly every nonprofit that loves that word “free.” It gathers a huge amount of data, but the two key elements it offers are network maps to visualize what is happening around social conversations, and surfacing the key players not by follower count, but by which of those accounts is generating the most subsequent actions. Dr. Marc A. Smith of Connected Action (one of the NodeXL partners) refers to this as “singing the praise of B-listers.” Many topics of interest have some folks Tweeting with very large follower counts. Those followers, however, are less likely to see those posts because those audiences follow HUGE numbers of accounts. In those cases, the lifespan of a tweet is mere seconds, so very few of the followers see any single tweet. B-listers may have fewer numbers, but have much more engaged audiences. Those folks are much more likely to both see a tweet and to act on it. Surfacing those people has been hard before tools like NodeXL.
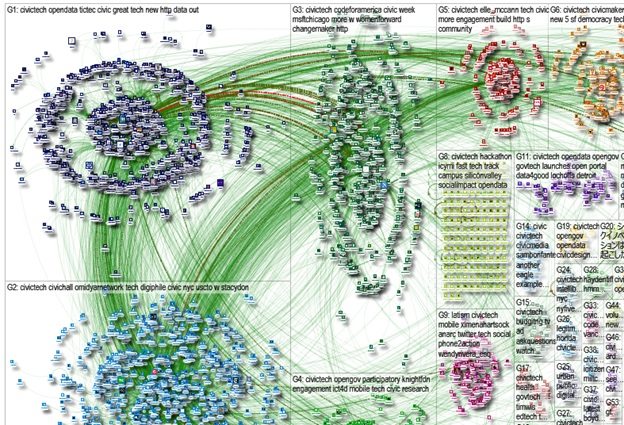
Keywords or account names can be the subject of a NodeXL graph and accompanying Excel data, but hashtags have a real opportunity to uncover B-listers that hadn’t been on an organization’s radar to that point. Conference tags can map out relationships and e-fluencers who should be contacted offline to solicit their help in getting the word out. The NodeXL Gallery has lots of examples of these kinds of graphs, including nonprofit hashtags such as #Civictech or #15NTC. Using the experimental feature to zoom in, sub-conversations become clear and “mayors” of conversations emerge.
It is possible to do all of this with just Excel and the free NodeXL plug-in, but doing so isn’t necessarily easy for the non-techie, nonprofit communications person. In those cases, it’s not a bad idea to ask someone on the NodeXL team to generate a graph for your search and then use that tool to help see if learning the rest of the system would be useful to generating a more engaged, and probably larger, audience on social media. There are YouTube tutorials as well as a book to help understand what the data will show. The amount of information may seem intimidating at first, but moving from scatter-shot to rifle-shot in amplifying the social message will pay off quickly with more action from the right audiences.