
This article comes from the spring 2020 edition of the Nonprofit Quarterly. It’s part of a series of articles addressing the last recession and informing nonprofits and philanthropies on options for our work and advocacy agendas in the impending recession. Watch for the next in this special series online. This article was updated on April 7, 2020.
The U.S. economy in 2008 through 2009—at the peak of the Great Recession—as well as during the recession’s immediate aftermath, was a personal financial disaster for millions of Americans. Ten million foreclosures were filed against homeowners in 2008 and 2009 (default notices, scheduled foreclosure auctions, bank repossessions);1 23 percent of private homes slid into negative equity by the third quarter of 2009;2 and the U.S. unemployment rate jumped from 4.7 percent to over 10 percent.3 (These figures are now beginning to pale in the current pandemic context, with some predicting twice that rate of unemployment.) Bank failures, a shrinking economy, and shaken consumer confidence convinced enough members of Congress and a newly elected President Obama to pass a nearly $840 billion stimulus package to jump-start the economy: the American Recovery and Reinvestment Act.4
Conventional wisdom has it that the recession must have been a difficult and painful period for the nonprofit sector, with reduced assets, funding, and employment—especially as, simultaneously, nonprofits saw exploding demand for such nonprofit services as food banks, emergency housing, fuel assistance, and employment counseling. But how difficult and painful was it?
By far the biggest news story of 2009, the Great Recession inspired no small amount of advice for nonprofits on how to cope with a shrinking economy, such as diversifying funding streams, using compassion when cutting staff, and launching social enterprises. As it turns out, most organizations survived this period. Now, with the benefit of a rearview mirror and big data, we can get an overview of what really happened across the breadth of the sector. Thanks to regularly collected government forms, employment data, and IRS-required financial filings, we are able to review the recent history of the U.S. nonprofit sector in the areas of employment, revenues, and assets, and break it down further by field of activity and geography.
Nonprofit Employment: Where’s the Dip?
News coverage of the state of the U.S. economy tends to focus on two numbers: the stock market and the unemployment rate. Below, a single chart (Figure 1) tells the barely known story of nonprofit economic resilience: The most striking difference between nonprofits and businesses in 2009 was that nonprofit employers kept their employees.5
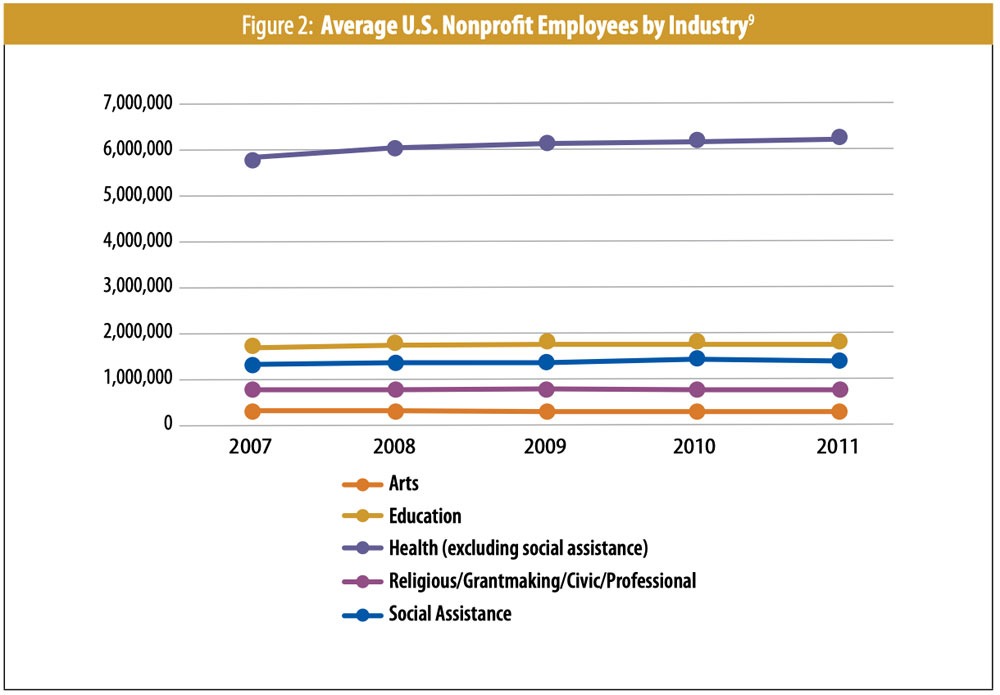
Throughout the recession, the sector recorded steady growth in its number and share of the U.S. workforce, and nonprofit employers experienced fewer unemployment claims than their business counterparts.6 Steady employment growth held true across all nonprofit activity areas during the recession, with 7 percent growth over five years.7
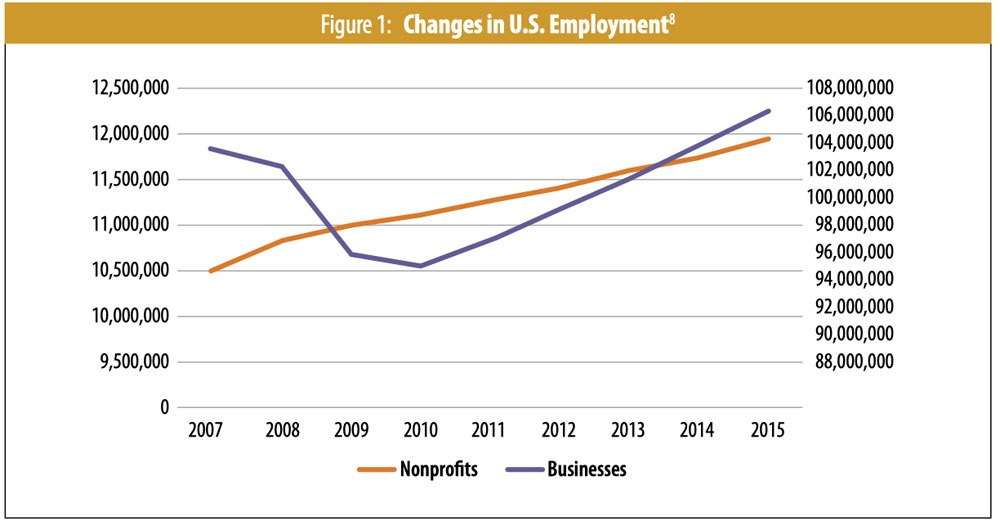
Business employment dropped by 6 percent in 2009—a loss of 6.4 million jobs—a year in which nonprofit employment grew by 1.5 percent.10
Nonprofit Finances: Where’s the Dip?
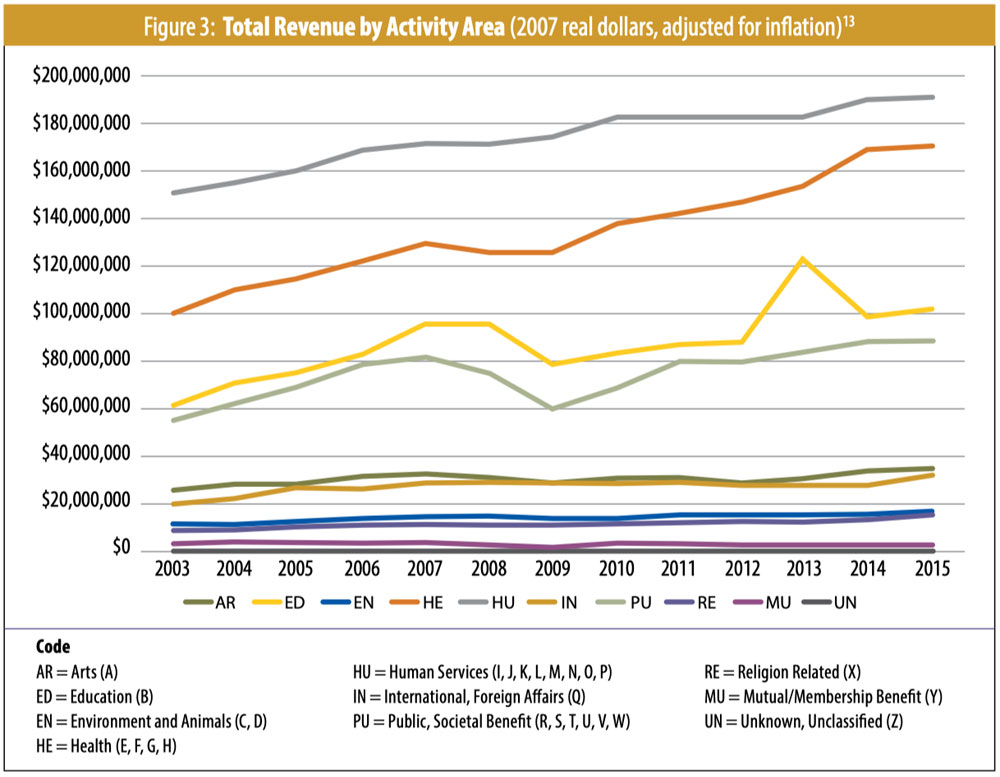
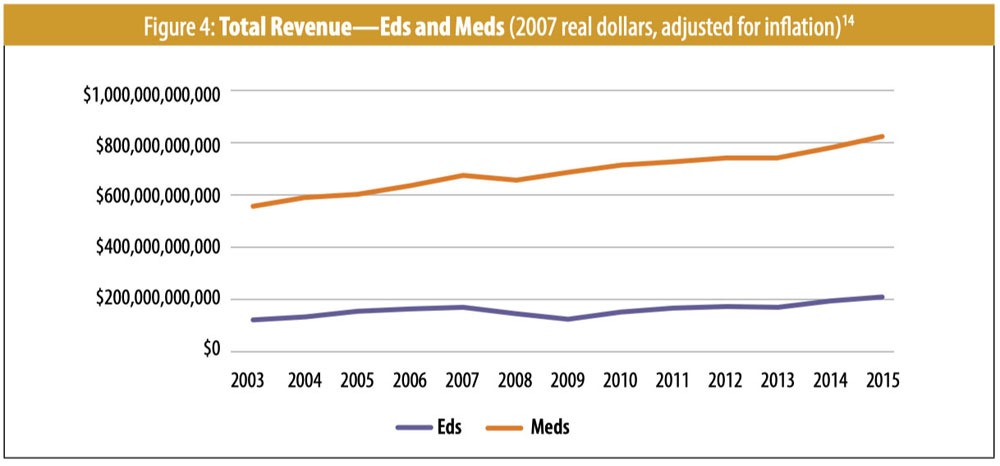
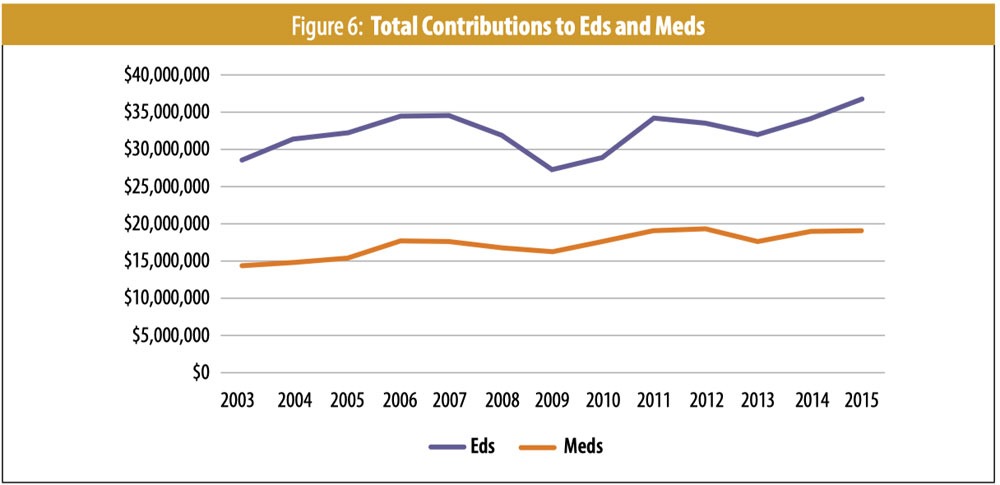
The top-line story here is that most parts of the nonprofit sector saw no reduction in overall financial resources, and actually grew throughout this period. Analysis of IRS Form 990 filings from 2003 to 2015 shows changes in total revenue over time in the ten major activity areas—and, separately, colleges and universities (“eds”) and hospitals (“meds”), which are analyzed apart because they have such a distinct financial footprint. While some activity areas experienced fluctuations in the recession years (such as human services, which saw a 2 percent increase in total revenue from 2008 to 200911), in most cases nonprofits saw a modest single-year reduction and a following-year recovery.12 (See Figures 3 and 4.)
Contributions
To understand the impacts of the recession on the U.S. nonprofit economy, it’s also necessary to look beyond overall revenue and more closely at specific types of support. Charitable contributions are an important source of revenue for nonprofit organizations, at 18 percent of total nonprofit revenue.15
As Figure 5 illustrates, the area of nonprofit activity that showed the greatest decline in charitable contributions was the National Taxonomy of Exempt Entities (NTEE) category of “Public Benefit,” which includes grantmaking organizations, United Ways, and community and industry associations.16 Some of the biggest entities in this category are large charitable affiliates of the financial services industry (Fidelity Charitable, Schwab Charitable, etc.). Contributions to these intermediary organizations declined by 16 percent from 2008 to 2009 (and total revenue declined by 21 percent).17
While contributed revenue to nonprofit organizations in other activity areas (such as human services and the arts) is frequently used within the year it’s received to fund operating expenses, contributed revenue to organizations in the public benefit activity area (particularly the charitable affiliates of the financial services industry) generally serves a different function, as an intermediary and discretionary contribution vehicle. Donors make decisions about contributions to these kinds of public benefit organizations as a part of wealth management for future charitable giving, including transfers into donor-advised funds (DAFs). There were several factors at play behind reduced contributions to public benefit organizations during the recession, including donors’ uncertainty in the face of the market decline—reduction in the donor’s charitable concern was not necessarily one of them. From 2007 to 2008, contributions to five of the largest DAF sponsors fell steeply: Vanguard, 20 percent; Fidelity, 40 percent; Schwab, 46 percent; Jewish Communal Fund, 52 percent; and Silicon Valley Community Foundation, 54 percent.18
Higher education (colleges and universities, aka “eds”) also showed great decline in charitable contributions over the time frame. This nonprofit category is one of the most popular (along with basic needs and the arts) among high-net-worth individual donors.19
Sign up for our free newsletters
Subscribe to NPQ's newsletters to have our top stories delivered directly to your inbox.
By signing up, you agree to our privacy policy and terms of use, and to receive messages from NPQ and our partners.
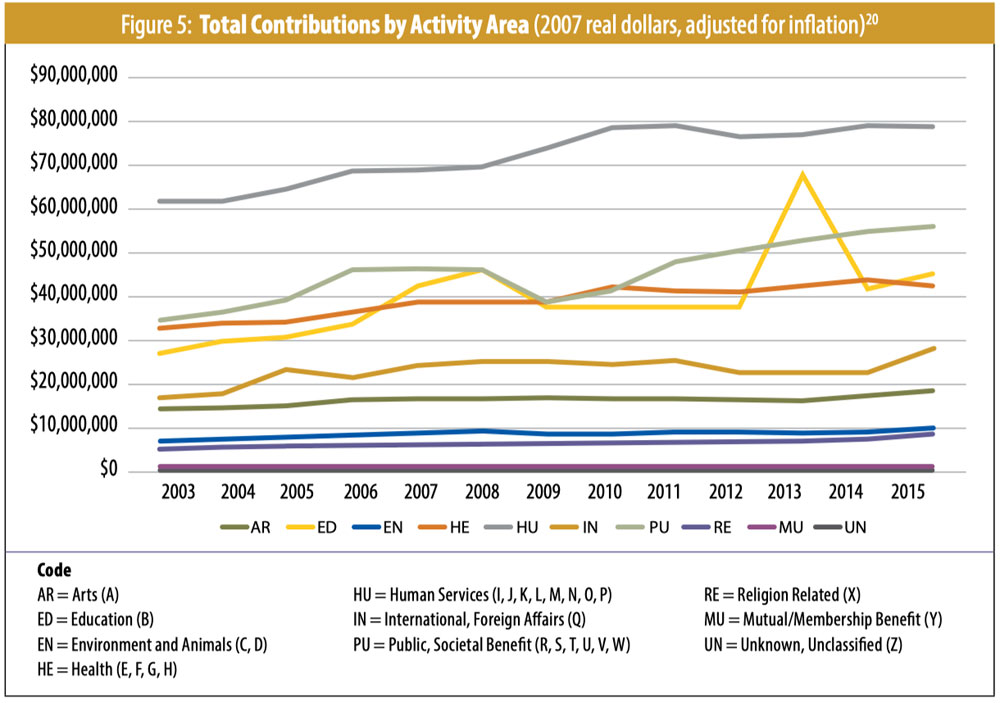
For example, in 2017, colleges and universities received the second highest share of donations from America’s wealthiest donors.21 These donors weren’t immune from the effects of the recession—in fact, the top 20 percent of households lost 14 percent of net worth.22 Unsurprisingly, studies show that overall charitable giving from wealthy donors declined over this time.23 With an increased demand on nonprofit services (especially basic needs), it appears higher education became a lower priority for wealthy donors during the recession, while other core areas (such as health and human services) grew in total contributions received during this time (see Figure 5). “Meds” (large hospitals and clinics), though, showed just a slight dip in contributions from 2008 to 2009 (see Figure 6).
Foundation Grants
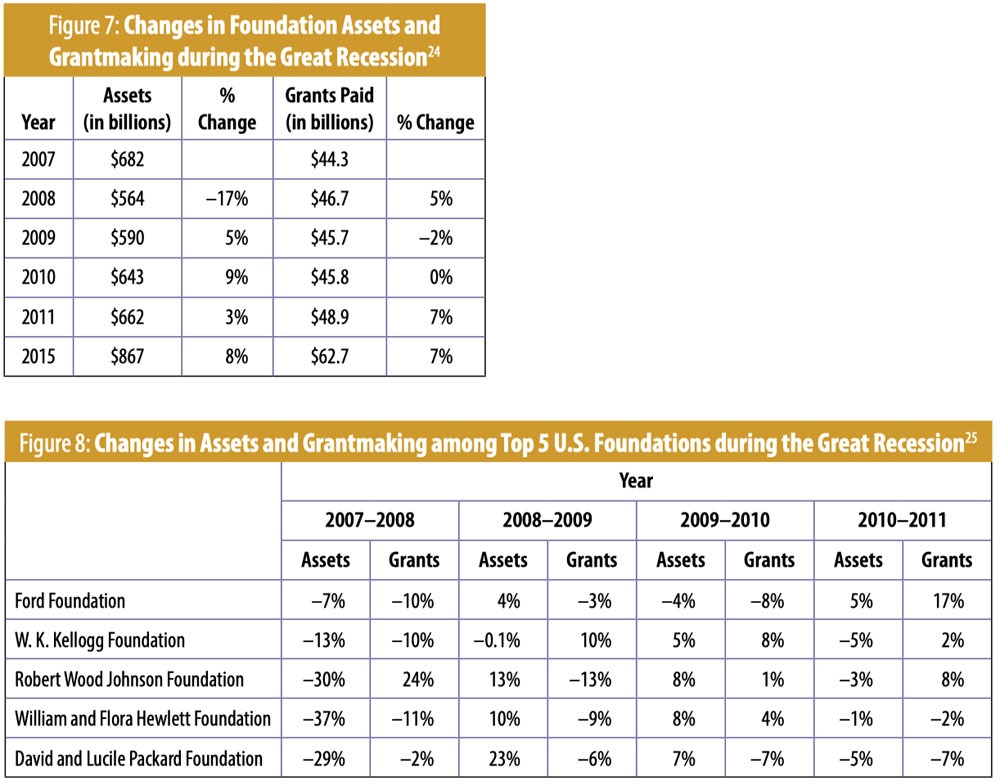
Funding from grantmaking foundations also plays an important role in the nonprofit economy, especially for smaller organizations that receive a higher percentage of their total revenue from grants. It is common practice for foundations to base their total grantmaking on the performance of their assets. Foundation assets took a nosedive when the stock market fell during the recession. While some had hoped foundations would adopt a “rainy day” strategy of increasing payout to be countercyclical by supporting communities hit hard by the recession,26 when their portfolios shrank, so did their grants. Foundation assets dropped by $80 billion from 2007 to 2008, but by 2015, foundations’ fortunes rebounded to $867 billion in assets and $62.7 billion in grants paid.27
Ten Years Later, Data Challenges in Understanding Nonprofits in Real Time
Every year, nonprofit managers and board members make decisions about trillions of dollars and millions of employees who make up 10 percent of the nation’s workforce28—a major slice of the economy. In an ideal world, nonprofits would have access to current economic performance information in as close to real time as possible to support informed decision making. The media attractiveness of the Dow Jones or Standard & Poor’s 500 numbers isn’t so much that they are highly accurate measures of the U.S. economy as that they are reported every day and show change over time.
For the nonprofit economy, tracking economic activity with quarterly employment filings or annual IRS forms means waiting one to three years (or longer) for aggregated data. Data on nonprofit finances are mainly available via the Form 990, which in theory requires nonprofits to file four-and-a-half months after the end of their fiscal year; but with automatic time extensions and delays in formatting and posting, the data become available much later.
As of this writing (February 2020), the most current data available would be 990 filings from 2018—stored in the IRS Master File29—for the most basic revenue, expenses, and assets. For a more complex picture of the nonprofit sector’s financial performance (such as changes within different types of nonprofit revenue, for example, contributions and program fees), the most current data available would be the 990 public charities “Core” filings from 2015, available at the National Center for Charitable Statistics.30 Researchers and practitioners are always waiting at least five years to get the most accurate picture of the nonprofit economy. This gap between available and desired nonprofit data access and timeliness has been addressed by the Nonprofit Quarterly for years—see, for example, “The Research System: A Public Utility on Which All Nonprofits (Should Be Able to) Depend”31—published during the deepest pit of the Great Recession, December 2008.
A country with substantial reliance on services from a broad network of nongovernmental organizations should invest more in nonprofit information infrastructure. The dilemma of long-term funding for resources like sector data is that foundations see themselves less as sustainers and more as pioneers and adventurers that explore new ground and then move on. For industry after industry, the U.S. departments of Commerce, Energy, Transportation, Labor, Health and Human Services, and Small Business Administration assume the responsibility of making data available. To maintain the core activities for an ongoing, widely accessible base of reliable and timely information on nonprofits might cost $15 million a year, which is a modest investment given the scale, scope, and expectations of the U.S. nonprofit sector.32
Without timely information, nonprofits end up with limited insights to support real-time decision making. Inadequate information also obscures both good and bad advice for nonprofits. Over the past decade, countless articles, blog posts, and consultants have advised nonprofits to pursue social enterprise—often defined in this context as the “productization” of a nonprofit’s goods or services to generate new revenue. Adopting for-profit business strategies for social good, social enterprise is often touted as a counterbalance to the supposedly negative impacts of recession on nonprofits, because of the promise of new revenue. Board members, executive directors, donors, and grantmaking foundations took the advice to heart and invested time and money pursuing or supporting this avenue during the Great Recession. The irony is that businesses were hit the hardest, and nonprofits generally did well. The advice to “be more like businesses” caused some in the sector to pivot unnecessarily, and at their peril.
…
Looking forward, in addition to wishing it had better information, the nonprofit sector can glean several lessons from its experience of the Great Recession:
- The impact of the next recession on nonprofits will likely depend on what a given organization’s activity area is, and this article gives some insight into how different types of nonprofit organizations are funded and therefore impacted by changes in the stock market and donor behavior. Nonprofits should be wary of blanket advice for “The Sector”: There is more than one way of understanding the sector, and differences among the types of nonprofits (and how they are funded) matter. Recommendations for additional reading are NPQ’s “Financial Strategy Tools: Cohort Analysis” and “Financial Independence: Six Approaches.”33
- While the nonprofit sector fared well in the aggregate, parts of the sector were negatively impacted by the recession. The activity area that got hit the hardest was “Public Benefit,” and the organizations in this category that saw the biggest drops in revenue were the charitable extensions of the financial services industry (such as Fidelity Charitable). Advice to nonprofits about how to survive the impact of a recession should be directed toward these groups. This part of the nonprofit sector is worth attending to separately because contributed revenue functions differently in these organizations.
- Not only did nonprofits continue to provide crucial community services at a time when financial losses hit communities hardest and drove up demand for nonprofit services, nonprofit organizations overall were also stable employers at a time when unemployment soared and businesses cut millions of jobs. Successfully delivering services, maintaining operations, weathering some financial losses, and successfully managing a diversity of revenue streams (all with different conditions attached) requires exceptional management skills and effective governance. Under the strain of the Great Recession, nonprofits demonstrated that they are more than capable of autonomous decision making and self-governance—and, as 10 percent of the nation’s economy, are a crucial stabilizing force in communities nationwide.
With special thanks to Nathan Dietz, River Fiocco, and Grace Fogland, who provided thorough data analysis and research in support of this article.
Notes
- Tommy Andres, “Divided Decade: How the financial crisis changed housing,” Marketplace, December 17, 2018.
- George R. Carter III and Alfred O. Gottschalck, “Drowning in Debt: Housing and Households with Underwater Mortgages,” U.S. Census Bureau, accessed February 20, 2020.
- S. Bureau of Labor Statistics, “The Recession of 2007–2009,” Spotlight on Statistics, February 2012.
- Congressional Budget Office, Estimated Impact of the American Recovery and Reinvestment Act on Employment and Economic Output in 2014 (Washington, DC: Congressional Budget Office, February 2015).
- Exactly how this was managed is not completely clear. See, for example, Ronald A. Wirtz, “The recession: Good for nonprofit employment?,” April 20, 2015, Federal Reserve Bank of Minneapolis.
- Analysis of U.S. Bureau of Labor statistics data on nonprofit and private employment from 2007 to 2011. See U.S. Bureau of Labor Statistics, “Quarterly Census of Employment and Wages,” United States Department of Labor, accessed February 20, 2020.
- Analysis of U.S. Bureau of Labor Statistics data on nonprofit employment from 2007 to 2011. See U.S. Bureau of Labor Statistics, “Business Employment Dynamics: Research Data on the Nonprofit Sector,” United States Department of Labor, accessed February 20, 2020.
- Chart created with data available from the U.S. Bureau of Labor Statistics, analyzing changes in the numbers of average annual employees in the nonprofit and private sectors. See U.S. Bureau of Labor Statistics, “Quarterly Census of Employment and Wages,” United States Department of Labor, accessed February 20, 2020.
- Analysis of U.S. Bureau of Labor Statistics data on nonprofit employment from 2007 to 2011.
- Analysis of Bureau of Labor statistics data on nonprofit and private employment from 2007 to 2011.
- Analysis of IRS Form 990 tax filings from 2007 to 2015, separated by nonprofit activity area.
- Ibid.
- Ibid. (The letters in parentheses in the chart’s Code refer to NTEE major groups of nonprofit activities that have been combined into ten broad categories. For more details, see Deondre’ Jones, “National Taxonomy of Exempt Entities [NTEE] Codes,” Urban Institute National Center for Charitable Statistics, revised April 2, 2019.)
- Ibid.
- Jon Pratt and Kari Aanestad, “NPQ’s Illustrated Nonprofit Economy: 3rd Edition,” Nonprofit Quarterly 26, no. 3 (Fall 2019): insert. (View online here.)
- Analysis of IRS Form 990 tax filings from 2007 to 2015, separated by nonprofit activity area.
- Ibid.
- Ibid.
- Michelle Nichols, “Giving by rich Americans fell during recession: study,” Reuters, November 9, 2010.
- Analysis of IRS Form 990 tax filings from 2007 to 2015, separated by nonprofit activity area. (The letters in parentheses in the chart’s Code refer to NTEE major groups of nonprofit activities that have been combined into ten broad categories. For more details, see Jones, “National Taxonomy of Exempt Entities [NTEE] Codes.”)
- Leslie Albrecht, “How the 1% give to charity,” MarketWatch, December 18, 2018.
- Benjamin Landy, “A Tale of Two Recoveries: Wealth Inequality After the Great Recession,” Century Foundation, August 28, 2013.
- Nichols, “Giving by rich Americans fell during recession.”
- Analyzed data from Foundation Directory Online (foundation statistics available at foundationcenter.org).
- Analyzed via publicly available IRS Form 990 filings for each foundation listed—percent change in reported assets and total dollars paid in grants for each listed year.
- Ralph Smith and Steve Gunderson, “What the Council on Foundations Should Have Said to Its Members,” Nonprofit Quarterly, October 29, 2008.
- Analyzed data from Foundation Directory Online (foundation statistics available at foundationcenter.org).
- U.S. Bureau of Labor Statistics, “Nonprofits account for 11.4 million jobs, 10.3 percent of all private sector employment,” TED: The Economics Daily, United States Department of Labor, accessed February 19, 2020.
- “Exempt Organizations Business Master File Extract (EO BMF),” IRS website, accessed February 7, 2020.
- NCCS Core Files, NCCS Data Archive, Urban Institute National Center for Charitable Statistics, accessed February 20, 2020.
- Jon Pratt, “The Research System: A Public Utility on Which All Nonprofits (Should Be Able to) Depend,” Nonprofit Quarterly 15, no. 4 (Winter 2008), published online December 21, 2008.
- Ibid.
- Jon Pratt, “Financial Strategy Tools: Cohort Analysis,” Nonprofit Quarterly 13, no. 1 (Spring 2006), published online March 21, 2006; and Jon Pratt, “Financial Independence: Six Approaches,” Nonprofit Quarterly 13, no. 3 (Fall 2006), published online September 21, 2007.
Jon Pratt is the executive director of the Minnesota Council of Nonprofits, codirector of GrantAdvisor.org, and a contributing editor to the Nonprofit Quarterly.
Kari Aanestad is director of advancement at the Minnesota Council of Nonprofits and codirector of GrantAdvisor.org. She also serves as vice president of the Minnesota-Northstar Chapter of the Grant Professionals Association.