
“OPEN POMEGRANATE” BY KAMILLE SAABRE/WWW.KAMILLE.EE
Editors’ note: This outline of some of what is known about state taxes is not comprehensive, but it indicates how diverse the tax picture is from state to state. It should be a reminder that as complex a challenge as federal tax reform may be, it is in some ways made immensely more so by both the interactions of state and federal tax systems and the nonprofit sector’s disunited, unintegrated advocacy approach to state taxes.
On Washington, D.C.’s Capitol Hill, charities have been involved in an all-consuming debate over the future of the federal charitable tax deduction. But can nonprofits effectively participate in the national debate over taxes and expenditures if they don’t know what is happening at the state level? There are fifty states with budgets that are paid for by taxes—fifty different states with fifty different mixes of tax rates, tax deductions, and tax credits. Understanding the mix of state tax regimes is crucial to nonprofit public-policy literacy.
There is no one definitive reference source for nonprofits on the impact of state tax climates on the sector. Unlike at the federal level, at the state level there is a panoply of tax policies that both directly and indirectly affect donations to public charities. While there is one federal income tax rate, there are wide variations among the states regarding their marginal rates, with a handful of states having no income taxes at all. And some states offer individuals and corporations tax credits, not just tax deductions, to incentivize contributions to the nonprofit sector.
Overall, states differ in their willingness to use their tax powers to promote policy objectives for nonprofits and the communities they serve. Unlike the microscopic attention nonprofits pay to federal tax policy issues, there is much less understanding of the complexities of state tax policies. Are nonprofits conscious of the differing tax climates affecting citizens and communities in the various states? How can nonprofits better grasp state attitudes toward taxes in order to craft effective state tax advocacy strategies?
The Big Picture
What characterizes state tax systems? While most people would probably think that the answer is income taxes, the largest source of state tax revenues as of 2011 was sales (and gross receipts) taxes (48.4 percent), followed by personal and corporate income taxes (39.5 percent), license taxes (6.8 percent), and all other state (gift and estate) taxes (5.3 percent).1
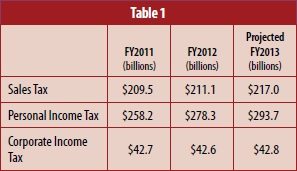
Adapted by the author from table 20: “Comparison of Tax Collections in Fiscal 2011, Fiscal 2012, and Enacted Fiscal 2013 (Millions),” The Fiscal Survey of States (Fall 2012)
More surprising to many people, individual income taxes are much larger as a revenue source than corporate income taxes—between six and seven times as much in both FY2011 and FY2012 and projections for FY2013 (see table 1).2
The flatlining of corporate income tax collections is striking, given how stridently many corporations bemoan state tax climates. The states with no corporate income taxes (per the National Governors Association’s 2012 survey, The Fiscal Survey of States) are Nevada, South Dakota, Texas, Washington, and Wyoming. All of these states, plus Alaska, Florida, and New Hampshire, show no personal income taxes.3 It would seem that personal income taxes should be declining, as only five states have enacted increases in personal income taxes for FY2013, compared to thirteen that have cut personal income taxes; but the higher taxes are in Arizona, California, and New York—states whose increases drive personal income tax revenues upward, compared to the other states that have cut marginal rates. Where corporate taxes are concerned, states have been acceding to the complaints of the business sector: while two increased corporate tax rates, nine cut them, and Arizona and West Virginia eliminated specific categories of corporate taxes altogether.
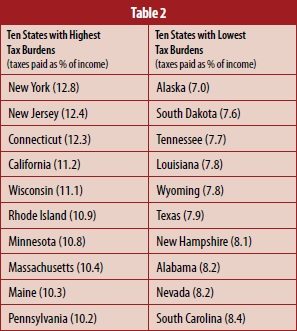
Table created by the author, based on information from USA Today (March 2, 2013)
Tax Climate Change
One dimension of a state tax climate is how much of a burden taxpayers face from state to state. USA Today ranks states by the combination of state and local tax burdens relative to their per capita income for fiscal years FY2010 to FY2012 (see table 2).4
These tax burden rankings are likely to change, with recently enacted tax increases or decreases in specific states, such as: California’s personal income tax increase for tax years 2012 through 2018 (projected to raise $4.735 billion in new revenues in FY2013 alone); New York State’s addition of three new tax brackets for taxpayers with incomes over $150,000 (aiming to bring in $1.931 billion in new revenues in 2013); and, in contrast, Ohio’s reduction in personal income taxes (-$446 million compared to FY2011) and the consolidation of tax brackets in Kansas (-$249.2 million).5 But the overall result is that the “high tax” states are largely in the Northeast and Mid-Atlantic, where state governments tend to provide more state aid to localities and state programs for the poor, and the “low tax” states are in the Southeast and Southwest, along with South Dakota and Alaska, where the scope of state government is smaller. (Alaska has the extra benefit of a huge infusion of oil tax revenue from the Trans-Alaska Pipeline knocking its need to rely on other tax sources way down—similar to North Dakota, which has also reduced its tax burden thanks to burgeoning oil shale revenues.)6
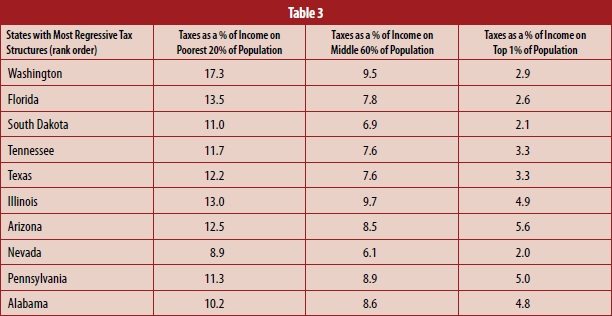
Taxes as shares of income by income for non-elderly residents. Institute on Taxation and Economic Policy, Who Pays? A Distributional Analysis of the Tax Systems in All 50 States (November 2009)
But tax burden is a gross indicator that reveals nothing about state tax fairness, which may be a much more important indicator of state tax climates (the extent to which state tax regimes are progressive or regressive in terms of their distributional equity). Unfortunately, according to the Institute on Taxation and Economic Policy’s November 2009 study of tax equity in the states, “nearly every state and local tax system takes a much greater share of income from middle- and low-income families than from the wealthy.” State and local tax burdens are extremely regressive in their treatment of (non-elderly) families (see table 3). Given that the states basically all lean more regressive than progressive in their tax systems, which are the most regressive?7
The overlap between the states with low tax burdens and those with regressive tax systems is self-evident: four of the regressive states rely highly on sales taxes and excise taxes; six lack broad-based personal income taxes. The least regressive locations, including New York, Vermont, and the District of Columbia, rely much more on income tax systems that tax the wealthier more and rely less on consumption taxes such as sales and excise taxes.8 Tax progressivity is enhanced by income taxes and diminished by consumption taxes.
Taxes with a Purpose
Taxes can be a tool to accomplish social objectives, as the notion of progressive and regressive tax regimes implies. Whether states choose to use taxes to help the poor or to promote public purposes adds another dimension to the picture of their tax climates. Important tax tools include income transfer mechanisms, such as state Earned Income Tax Credits, Child Tax Credits, and Child and Dependent Care Tax Credits, as well as taxes—such as those on liquor and gasoline—intended to discourage certain behaviors.
Earned Income Tax Credits. According to the Internal Revenue Service, twenty-four states,9 one district (Washington, D.C.), and two local jurisdictions (New York City and Montgomery County, Maryland) offer refundable Earned Income Tax Credits (EITCs)10—meaning that if the size of the family’s credit exceeds the amount of state income tax it owes, the family receives the difference in the form of a refund11—in contrast with a partially refundable EITC in Rhode Island and nonrefundable EITCs in Delaware, Maine, and Virginia.12
The progressivity of the EITC is that it provides a tax credit for the working poor—defraying the unnecessary taxes the poor are hit with at the state and federal levels, and providing a source of supplemental income. Unfortunately, not all states are open to EITCs, and some appear to be moving in reverse, given the recent vote of the North Carolina House of Representatives to terminate that state’s EITC in 2014,13 and efforts to cut state EITCs in Michigan, Kansas, Wisconsin, and New Jersey—all with Republican governors, all couching their proposed slashes in the EITC under the guise of balancing state budgets.14
Child Tax Credits and Child and Dependent Care Tax Credits. Some states further supplement the intention of their EITC with a Child Tax Credit (CTC) to help working families with the cost of raising families. According to Tax Credits for Working Families, New York and Oklahoma offer CTC programs based on a percentage of the federal version of the tax credit, while North Carolina and California use their own formulas.15
Tax Credits for Working Families reports that twenty-four states have Child and Dependent Care Tax Credit (CDCTC) programs in operation, helping working families pay for the cost of taking care of dependent children, adults, and incapacitated spouses. Unlike the EITC and the CTC, a CDCTC is typically nonrefundable, meaning that it is only paid as a percentage of the family’s actual child-care expenses.16 In 2011, the National Women’s Law Center counted thirty-four states with some sort of child-care tax credit or deduction program:17
- Programs based on a percentage of the federal child-care tax credit: Arkansas, California, Colorado, Delaware, the District of Columbia, Georgia, Iowa, Kansas, Kentucky, Maine, Maryland, Nebraska, New York, Ohio, Oklahoma, Rhode Island, and Vermont.
- Programs that provide a deduction of a percentage of federal tax credit–eligible expenses: Idaho, Maryland, Massachusetts, and Virginia.
- Programs with other calculations for child-care tax benefits: Hawai’i, Louisiana, Minnesota, Montana, New Mexico, North Carolina, Oregon, and South Carolina.
The EITC, CTC, and CDCTC programs are all meant to supplement the ability of the working poor to survive and stay employed. The alternative for families that would qualify for these programs is to slide back into welfare. These tax incentives compensate for the all-too-frequent shortcomings in low-income wages that, without these programs, would lead families back into dependence on Temporary Assistance for Needy Families (TANF).
Sign up for our free newsletters
Subscribe to NPQ's newsletters to have our top stories delivered directly to your inbox.
By signing up, you agree to our privacy policy and terms of use, and to receive messages from NPQ and our partners.
“Sin” Taxes. Other tax programs aim at taxing and dis-incentivizing activities or the use of products that may not be socially beneficial. The most common are taxes on cigarettes and liquor. Forty-seven states plus the District of Columbia and New York City levy cigarette taxes.18 The smallest cigarette taxes are the 30 cents per pack in Virginia, Louisiana’s 36-cent tax, Georgia’s 37-cent tax, and Alabama’s 42.5-cent tax. The largest are New York State’s $4.35 (not including New York City’s tax of $1.50 a pack), Rhode Island’s $3.50, and Connecticut’s $3.40. All of the states, plus the District of Columbia, tax distilled spirits, with a national average of $3.75 a gallon, according to the FTA, and beer at $0.19 a gallon, excluding additional sales-tax charges.19 During the recent economic recession, the pressure to increase taxes on the use of “noxious” substances such as tobacco and alcohol has had the additional attraction of raising states’ revenues.20
The gasoline tax is another matter. Based on the specific excise tax on gasoline, as of 2012 the states with the highest gas taxes were North Carolina (38.9 cents per gallon), Washington (37 cents), California (35.7 cents), and Rhode Island (32 cents).21 In most cases, the revenues from state gasoline excise taxes are used for the cost of roads and bridges, but most states haven’t adjusted their gasoline taxes in many years. In 2011, the Institute for Taxation and Economic Policy noted that actual gasoline excise taxes (not including local sales taxes and other fees that are regularly bemoaned by the American Petroleum Institute and others) have fallen to an average of 6.8 cents per gallon, lagging well behind both increases in automobile usage and the cost of road and bridge repairs.22
The Nonprofit Tax Issues
Nonprofits are typically concerned with deductions or incentives for charitable giving as the key indicator of a state government’s nonprofit tax climate, but there are some other targeted tax programs of importance to nonprofits because of their impacts in providing funding for specific kinds of nonprofit organizations and projects. Two of these bear special mention because of their targeting of nonprofit end-users: Tuition Tax Credits and Neighborhood Assistance Tax Credits.
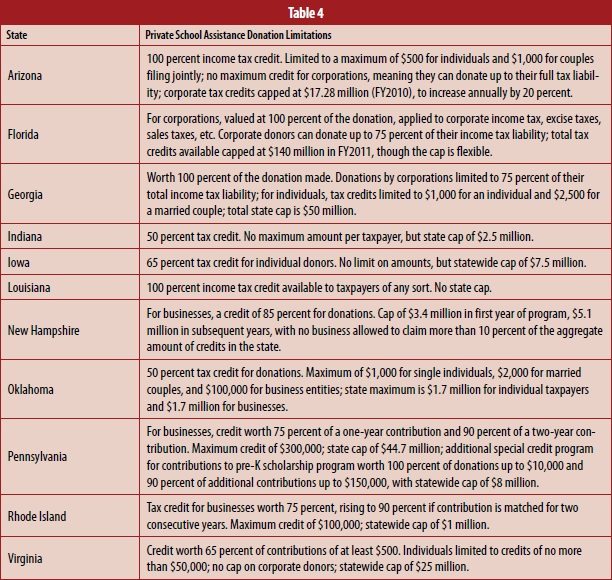
Adapted by the author from information from the National Conference of State Legislatures
Tuition Tax Credits. One of the most controversial tax programs has been the deduction for corporations and individuals—depending on the state—for donations to state scholarship programs to pay for the cost of pupils to attend K–12 private schools. In other words, these are tax programs for financing school-voucher programs. As of September 2012, there were eleven states with some sort of program giving taxpayers credits for donations to private school scholarship assistance (see table 4).23
In almost all instances, these credits are meant to support scholarships for lower-income students to attend private schools, although some programs, such as Arizona’s and Georgia’s, lack that income targeting. New Hampshire’s program can be used to pay for the expenses of homeschoolers. Some of these programs have been challenged because of their openness toward and capacity for subsidizing the school expenses of students at religious schools, with split decisions by the courts—the U.S. Supreme Court nixing Louisiana’s program of permitting public schools to teach creationism but upholding Arizona’s program, which has been excoriated for mismanagement and fraud, resulting in subsidies for affluent students.24 But the ideological pressure of promoting school choice seems to overcome questions about which students and families are receiving assistance or whether creationism and intelligent design are appropriate subject matter for state subsidization through tax credits.25
Neighborhood Assistance Tax Credits. More than a dozen states offer a corporate tax credit that is geared toward supporting the projects of community-based nonprofits. The first “Neighborhood Assistance Program” (NAP) was in Pennsylvania, dating back to 1967. Pennsylvania’s program has now evolved into five tax credit programs—the regular Neighborhood Assistance Program, the Special Program Priorities (SPP), the Neighborhood Partnership Program (NPP), the Enterprise Zone Program tax credit (EZP), and the Charitable Food Program (CFP).
In Pennsylvania’s Neighborhood Partnership Program, outlined in their September 2012 guidelines (to describe one variation on the neighborhood assistance tax credit), the state gives corporations a 75 percent tax credit for supporting a neighborhood organization for at least five years and an 80 percent credit if the corporations extend their collaboration with neighborhood nonprofits six years or longer. The benefiting projects can address affordable housing, community economic development, crime prevention, job training, education, community services, or neighborhood conservation. Pennsylvania’s program is generous to corporate participants but distinctive in incentivizing long-term corporate commitments to specific projects.
A participating firm can get a maximum tax credit of $500,000 annually for supporting three or fewer projects or $1,250,000 for four or more projects, with minimum levels of cash and in-kind project support of $100,000, and allowed to be a mix of no less than $50,000 cash. These caps appear to apply cumulatively to all of the state’s neighborhood assistance programs, including the Special Program Priorities, which currently calls for projects related to state-established priorities, such as integrated weatherization and housing, preventing mortgage foreclosure, encouraging racial and ethnic diversity in communities, and supporting Marcellus Shale–related projects.
The number of states emulating some aspect of Pennsylvania’s Neighborhood Assistance Program currently include:
- Connecticut: 60 percent tax credits generally, but 100 percent for certain energy conservation projects, limiting businesses to $150,000 in credits annually and limiting nonprofit recipients to receiving $150,000 in program support through the credits;
- Delaware: 50 percent tax credits for business or individual taxpayer donors to nonprofits delivering community services, crime prevention, economic development, education, and affordable housing services in low- or moderate-income communities, capping the benefit to any taxpayer at $100,000, and with a statewide cap of $500,000;
- Indiana: 50 percent tax credits for business and individual taxpayers, capped statewide at $2.5 million, for donations to approved nonprofit projects in affordable housing, counseling, child care, educational assistance, emergency assistance, job training, medical care, recreational facilities, downtown rehabilitation, and neighborhood commercial revitalization benefiting low- and moderate-income communities;
- Maryland: 50 percent tax credits for donations of cash or goods, by corporations or individuals, for supporting specific state-approved projects—limit of $250,000 in tax credits per taxpayer;
- Missouri: 50 percent or 70 percent tax credits, the latter for projects in designated low-income urban or rural areas, for business donations to approved Neighborhood Assistance Projects—$10 million cap for 50 percent credits, $6 million for 70 percent credits;
- New Hampshire: 75 percent business tax credits, administered by the Community Development Finance Authority, for donations to approved projects;
- New Jersey: 100 percent tax credits for business donors to nonprofits carrying out comprehensive neighborhood revitalization plans, with the recipient nonprofits committing to using 60 percent of what they receive on affordable housing or economic development—state cap of $10 million; and
- Virginia: 65 percent tax credits, with a total of $7 million administered by the Department of Social Services for human services programs and $8 million by the Department of Education for education nonprofits.
Like other tax programs benefiting lower-income communities, Neighborhood Assistance Programs have on occasion been slated for budget cutbacks in recent years (such as Pennsylvania’s, Missouri’s, and Indiana’s), though the state-level advocacy of nonprofit coalitions has helped preserve and defend these programs from deeper cuts.26 Because NAP projects must be specifically approved by designated state agencies, ideology can sometimes come into play—as in 2011, when Indiana rejected Neighborhood Assistance Program support for Planned Parenthood.27 In light of the states’ generally low tax levies on corporate income, the fact that the tuition tax credits and the neighborhood assistance tax credits primarily benefit corporate taxpayers does raise questions about nonprofits trading a concern for tax equity for access to tax-incentivized contributions.28
The Big Kahuna Not:
State Charitable Deductions
Nationally, the charitable tax deduction costs the federal government $36 billion as an incentive for charitable giving. Does the generosity of the federal charitable deduction obviate the need for state incentives for charitable donations?
Interestingly, like the Neighborhood Assistance Program and the tuition tax credit programs, state incentives directed to charitable giving seem to have the flavor of special initiatives, as compared to the federal deductions, which are solid and relatively broad-based components of the tax code. Without offering an exhaustive list, the state charitable giving programs, with several targeted toward building community foundation endowments, include the following:
- Arizona’s program, involving a maximum credit of $200 for individual taxpayers and $400 for taxpayers filing jointly for donations to 501(c)(3) charities or to community action agencies receiving Community Services Block Grant funds—so long as the recipient organizations spend at least half of their budgets on services to Arizona families receiving Temporary Assistance for Needy Families (TANF), to low-income Arizona households, or to chronically ill or physically disabled Arizona children;
- Colorado’s Checkoff Colorado program, offering specific charities for taxpayer support, basically allowing taxpayers to make donations from taxpayer refunds or to add to their tax liabilities;29
- Idaho’s state charitable tax credit program, until recently a 20 percent credit for individuals donating to specified Idaho youth and rehabilitation facilities, which increased in 2010 to 50 percent for taxpayers donating to educational entities such as nonprofits serving public or private schools, public libraries, nonprofit museums, the Idaho Historial Society, and state commissions or councils on Hispanic affairs, the blind and disabled, developmental disabilities, libraries, and the deaf;30
- Iowa’s Endow Iowa program, for individuals and businesses, worth a 25 percent tax credit for donations to endowed charitable funds, capped statewide at $4.5 million, and, as of 2011, the maximum annual tax credit for a taxpayer limited to $175,000 for individual taxpayers and $350,000 for joint filers;31
- Kentucky’s SB 227 program, offering donors a 20 percent tax credit for donations to an endowment or a county fund sponsored by a community foundation or affiliate, the credit capped at $10,000 per donor and the statewide cap set at $500,000;
- Michigan’s state tax credit program, a 50 percent credit limited to $100 for individuals and $200 for joint filers, for charitable donations to community foundations, state universities, public libraries, homeless shelters, and food banks (Michigan closed the program at the end of 2011, however, due to the state’s budget deficit);32
- Montana’s endowment tax credit program, a 40 percent tax credit for individual and joint-filer taxpayers and a 20 percent tax credit for businesses;
- North Dakota’s state tax credit program, for donors who contribute to charitable endowments or community foundations, worth 40 percent of the deduction allowed by the IRS to a maximum of $10,000 per individual taxpayer and $20,000 for joint filers;
- Oregon’s state tax credit program, allowing taxpayers to match a donation they may make to any of 1,326 participating cultural organizations with a match to the Oregon Cultural Trust, worth a tax credit for the Cultural Trust donation of up to $500 for individuals, $1,000 for couples filing jointly, and $2,500 for corporations. With the program set to expire in 2014, the legislature will consider its reauthorization in 2013.
Although there are some states, such as Maryland, that simply offer a charitable deduction against state taxes, the trend in the various state programs enumerated above is to incentivize charitable deductions for specific kinds of charities or for the capitalization of somewhat permanent charitable endowments. In the aggregate, charitable giving incentive programs at the state level do not appear to cost states much in lost revenues but also do not generate significant amounts of charitable gifts. Although the federal charitable deduction is the key incentive that nonprofits have lobbied extensively to preserve amid pressures for budget cuts and tax reform at the federal level, charities in the various states benefiting from these state charitable giving incentives value every dollar they get.
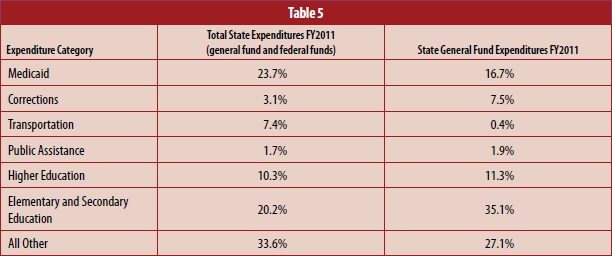
Adapted by the author from figures 4, 6, and 8, State Expenditure Report (2012)
The State Tax Climate Takeaway
The complexity of state tax systems makes it very difficult to make specific statements about state tax “climates” or “attitudes.” Most states are a mix of regressive and not so regressive tax policies for people in need, with several states offering specific tax programs that benefit charities. In all states there seems to be a continuing push for tax reductions, even on the seemingly undertaxed corporate sector and hardly taxed upper-income taxpayers and corporations—a movement that increases the regressivity of state tax regimes and “climates.” In truth, an analysis of state climates cannot focus simply on the basis of the mix of taxes and fees plus credits and deductions. The core issue is what state tax revenues are being used for. Table 5 suggests some of the issues for evaluating state tax climates in terms of how their revenues are put to use.33
Within those expenditure categories are wide variations among the states in terms of how they spend their tax revenues. For example, a truly tiny proportion of state expenditures go to public assistance, but between FY2011 and FY2012, Arizona cut its commitment of general funds to public assistance by 100 percent, while Tennessee increased its same by 525 percent. Every state in the nation increased the proportion of its general fund expenditures devoted to Medicaid except for California, Oregon, and South Carolina. A truly accurate description of state tax climates would have to combine perspectives on revenue inflows with an analysis of how the state-generated funds are being used.
The nonprofit sector has long complained about state government contracting and grantmaking policies. How can the nonprofit sector call for changes in the processes of state government revenue outflows without having a reasonably comprehensive database of how the states stack up on the ways they generate revenue inflows—tax levies, tax credits, and tax deductions? It seems analytically impossible to argue for or against state tax policies without a comprehensive database for drawing comparisons.
This is essential to nonprofit tax-policy advocacy. Nonprofits must understand how states raise their money in order to weigh in on how they should spend their money, and it is difficult to imagine nonprofits participating effectively and knowledgeably in the national debate over taxes if they don’t have a solid grounding in what is happening in their states and how state tax policies intersect with the federal tax code. If the nonprofit sector focuses narrowly on state tax incentives for charitable giving, omitting attention to other tax policies that affect nonprofits and the communities they serve, it will have missed the bigger and more important picture of the role of state government in addressing human needs.
NOTES
- Cheryl H. Lee, Mara Beleacov, and Nancy Higgins, State Government Finances Summary: 2011, Governments Division Briefs (Washington, DC: U.S. Census Bureau, 2012), 3, www2.census.gov/govs/state/11statesummaryreport.pdf.
- National Governors Association and National Association of State Budget Officers, The Fiscal Survey of the States: An Update of State Fiscal Conditions (Washington, DC: National Association of State Budget Officers, 2012), 43, table 20, www.nasbo.org/sites/default/files/Fall%202012%20Fiscal%20Survey%20of%20States.pdf.
- Ibid. New Hampshire actually collects taxes on interest, dividends, and capital gains, but not on wages and salaries. Tennessee has the same structure, but in the NGA survey, its income from these sources is classified as personal income tax receipts.
- David Carrig and Robert W. Ahrens, “States with the Highest and Lowest Tax Burdens,” USA Today, March 2, 2013, www.usatoday.com/story/money/personalfinance/2013/03/02/state-local-tax-burden/1937757/.
- The Fiscal Survey of the States, 48, table 23; appendix, table A-1.
- Elizabeth Malm and Gerald Prante, “Annual State-Local Tax Burden Ranking: New York Citizens Pay the Most, Alaska the Least,” Tax Foundation Background Paper, no. 65 (Washington, DC: Tax Foundation, October 2012). taxfoundation.org/sites/taxfoundation.org/files/docs/BP65_2010_Burdens_Report.pdf.
- Carl Davis et al., “The Ten Most Regressive State Tax Systems,” Who Pays? A Distributional Analysis of the Tax Systems in All 50 States, 3rd ed. (Washington, DC: Institute on Taxation and Economic Policy, 2009), 2, www.itepnet.org/whopays3.pdf.
- Ibid., 3.
- Colorado has had EITC legislation since 1999, but its program only operates when there is a state budget surplus. It made its last EITC payments in 2001.
- “States and Local Governments with Earned Income Tax Credit,” Internal Revenue Service, last updated March 1, 2013, www.irs.gov/Individuals/States-and-Local-Governments-with-Earned-Income-Tax-Credit. The twenty-four states are Connecticut, Illinois, Indiana, Iowa, Kansas, Louisiana, Maryland, Massachusetts, Michigan, Minnesota, Nebraska, New Jersey, New Mexico, New York, North Carolina, Oklahoma, Oregon, Vermont, Washington, and Wisconsin.
- “Earned Income Tax Credit,” Tax Credits for Working Families, accessed March 20, 2013, www.taxcreditsforworkingfamilies.org .
- “States and Local Governments with Earned Income Tax Credit.”
- Jessica Jones, “House Wants to End Earned Income Tax Credit,” North Carolina Public Radio-WUNC, February 20, 2013, wunc.org/post/house-wants-end-earned-income-tax-credit .
- The Republican governor of Kansas, Sam Brownback, has promoted a significant reduction in state taxes, but accompanying it would be an even more significant reduction of various tax credits and incentives, including the state’s incentive for charitable giving; cf. Rick Cohen, “Cutting the Earned Income Tax Credit to Balance State Budgets,” Nonprofit Quarterly, online feature published March 29, 2011, www.dev-npq-site.pantheonsite.io/updates/10801-cutting-the-earned-income-tax-credit-to-balance-state-budgets.html.
- “Child Tax Credit,” Tax Credits for Working Families, accessed March 20, 2013, www .taxcreditsforworkingfamilies .org ; Michigan ended its child tax credit program in 2013: “Residents Facing Higher Taxes,” South Bend Tribune, February 20, 2013, articles .southbendtribune.com/2013-02-20/business/37207597_1_refundable-credit-higher-taxes-business-taxes.
- “Child and Dependent Care Tax Credit,” Tax Credits for Working Families, accessed March 20, 2013, www.taxcreditsforworkingfamilies.org .
- Nancy Duff Campbell, Amy K. Matsui, Julie G. Vogtman, and Anne W. King, Making Care Less Taxing: Improving State Child and Dependent Care Tax Provisions (Washington, DC: National Women’s Law Center, 2011), 14–17, www.nwlc.org/sites/default/files/pdfs/nwlc-mclt2011-without_report_card_inside_and_bookmarked.pdf.
- “State Excise Tax Rates on Cigarettes,” Federation of Tax Administrators, January 1, 2013, www.taxadmin.org/fta/rate/cigarette.pdf.
- “State Tax Rates on Distilled Spirits,” Federation of Tax Administrators, January 1, 2013, www.taxadmin.org/fta/rate/liquor.pdf; “State Tax Rates on Beer,” Federation of Tax Administrators, January 1, 2013, www.taxadmin.org/fta/rate /beer.pdf.
- Justin Ewers, “States Eye Higher Taxes on Beer, Wine, and Liquor,” US News, December 18, 2008, www .usnews .com /news /national /articles /2008 /12 /18 /states -eye -higher -taxes -on -beer -wine -and -liquor; Meg Wagner, “Alcohol Tax Debated in States Across the Nation,” ABC News, October 26, 2010, abcnews.go.com/Business/alcohol-tax-debated-states-nation/story?id=11941733.
- “State Gasoline Tax Rates, as of January 1, 2012,” Tax Foundation, February 16, 2012, taxfoundation.org/article/state-gasoline-tax-rates-january-1-2012.
- Building a Better Gas Tax: How to Fix One of State Government’s Least Sustainable Revenue Sources (Washington, DC: Institute on Taxation and Economic Policy, 2011), 1, www .itep .org /bettergastax /bettergastax .pdf.
- “Tuition Tax Credits,” National Conference of State Legislatures, accessed March 20, 2013, www.ncsl.org/issues-research/educ/school-choice-scholarship-tax-credits.aspx.
- Lindsey Burke, “Supreme Court Throws Out Challenge to Arizona Tuition Tax Credit Program,” The Foundry (blog), The Heritage Foundation, April 4, 2011, blog.heritage.org/2011/04/04/supreme-court-throws-out-challenge-to-arizona-tuition -tax-credit-program/; Rick Cohen, “Public Funding for Teaching Creationism? La. Tries Again,” Nonprofit Quarterly, online feature, published August 2, 2012, www.dev-npq-site.pantheonsite.io/policysocial-context/20759-public-funding-for-teaching-creationism-la-tries-again.html.
- Michelle Reese, “Private School Tax Credits Rife with Abuse,” East Valley Tribune, August 1, 2009, www.eastvalleytribune.com/news/article_7debd2e5-d000-5aed-b813-a0d252377755.html .
- Eric Lidji, “State Cuts EITC; Tax Credit Prorated This Year, Cut Further Next Year,” The Jewish Chronicle, October 15, 2009, www.thejewishchronicle.net/view/full_story/4004677/article-State-cuts-EITC-Tax-credit-prorated-this-year-cut-further-next-year; Vicki Brown, “Possible Tax Credit Cuts, Redistribution Threaten MBCH, Other Social Service Agencies,” Word & Way, April 7, 2010, www.wordandway.org/index.php?option=com_content&task=view&id=1220&Itemid=198; “Around Indiana in June: Regional Meetings and General Assembly Recap,” Indiana Association for Community Economic Development, July 11, 2011, www.iaced.org/2011/07/around-indiana-in-june-2011/.
- Megan Reback, “Indiana Planned Parenthood Loses Tax Credit Due to New Abortion Law,” Talking Points Memo, June 20, 2011, tpmdc.talkingpointsmemo.com/2011/06/indiana-planned-parenthood-loses-tax-credit-due-to-new-abortion-law.php.
- Rick Cohen, “Do Charitable Tax Credits Work?” Nonprofit Quarterly, online newswire, January 27, 2011, www.dev-npq-site.pantheonsite.io/index .php?view=article &id=9166.
- For a list of eligible Colorado nonprofits, see “About Checkoff Colorado,” Checkoff Colorado, accessed March 20, 2013, www.checkoffcolorado.com/about/index.php. As of 2003, forty-one states and the District of Columbia offered some 220 state tax checkoffs—see “Checkoff Programs See Strong Growth,” Federation of Tax Administrators, accessed March 20, 2013, www.taxadmin.org/fta/rate/Checkoff03.html for details.
- Vanessa Grieve, “New Tax Credit May Benefit Struggling Organizations,” Idaho State Journal, December 30, 2010, www.highbeam.com/doc/1P3-2225155411.html.
- “Endow Iowa,” Iowa Area Development Group, accessed March 20, 2013, www.iadg.com/foundation/endow-iowa.aspx.
- Kristin Longley, “Give Soon or Don’t Receive,” Flint Journal, June 12, 2011.
- National Association of State Budget Officers, State Expenditure Report: Examining Fiscal 2010–2012 State Spending (Washington, DC: National Association of State Budget Officers, 2012), 5–6, www.nasbo.org/sites/default/files/State%20Expenditure%20Report _1.pdf.
Rick Cohen is the Nonprofit Quarterly’s correspondent at large.