In 2006, the Association of Fundraising Professionals (AFP) and the Center on Nonprofits and Philanthropy at the Urban Institute established the Fundraising Effectiveness Project (FEP) to conduct research and help nonprofit organizations increase their fundraising results at a faster pace. The FEP launched the Growth in Giving Analytics Initiative (GiG) in 2012 to capitalize on the vast amount of data about giving patterns that fundraising software vendors collect on an ongoing basis.
A relatively new project called Growth in Giving (GiG) has begun to do some deep, specific dives on giving patterns that promise to provide practitioners with a level of granularity that may make fundraising data more relevant. We offer the proviso that since the data has been drawn from software providers, it does not include data about the fundraising of very large organizations, which often have their own custom software. But this is a case of caveat lector—reader, be advised. (Those contributors, by the way, are, as listed, the Urban Institute, the Association of Fundraising Professionals, SofterWare/DonorPerfect, Bloomerang, Philanthropic Service for Institutions, DonorTrends, Abila, and Neon.)
In this report, Giving USA Philanthropy Spotlight: Benchmarking Giving to Human Services, the project has looked at giving to human services organizations, and it has found some interesting and frequently surprising trends. The most important takeaway is that the growth rate of giving to human services organizations increased by 58.1 percent over the six-year period from 2009–2015, compared to the 48.6 percent seen by other nonprofits.
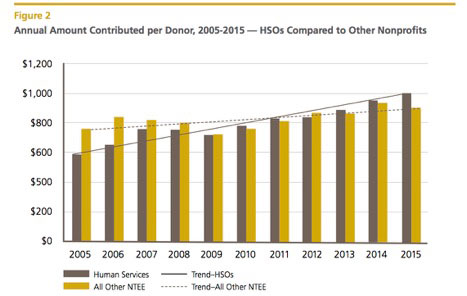
In addition, by calculating “the average contribution for each year between 2005 and 2015, the analysis showed that per-donor giving to HSOs increased at a much faster rate than giving to other types of nonprofit organizations.”
The average amount contributed per donor has increased in recent years (in nominal dollars) for both human services organizations and non-HSO nonprofits. However, the average annual amount per donor has increased at a much higher rate for HSOs, particularly during the Great Recession (2008–2010) and the years since. In 2005, the typical donor to an HSO contributed about $586 overall to that organization.
In 2015, that figure had grown to $1,000, an increase of 70.7 percent. For non-HSO nonprofits, the average amount per donor grew from $756 in 2005 to $898 in 2015, an increase of 18.9 percent.
According to the Urban Institute, HSOs made up 35.5 percent of all public charities in 2014, but received just 11.7 percent of all charitable donations that year. In contrast, per Giving USA 2016, 32 percent of all donations were given to religion and 15 percent went to education. But the outsized and continued growth of giving to human services suggests the potential of a small shift afoot. The pivot occurred as the recession hit, which is a historic pattern—in times of great financial need, donors turn more of their attention and money to basic needs (see figure 3)—but this time it appears that the HSOs have done better at maintaining and growing the expansion.
Sign up for our free newsletters
Subscribe to NPQ's newsletters to have our top stories delivered directly to your inbox.
By signing up, you agree to our privacy policy and terms of use, and to receive messages from NPQ and our partners.
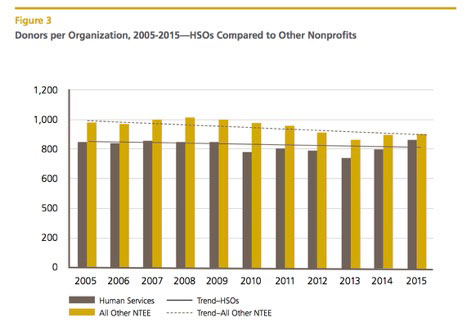
According to this report, “Between 2009 and 2015, a period that includes the recovery from the Great Recession, dollars per organization increased by 42.4 percent for HSOs and by 24.8 percent for other nonprofits.”
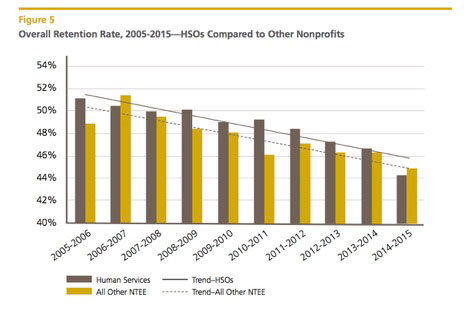
But before rejoicing, you may wish to consult Figure 5 of the report, which shows the overall plummeting of the all-important donor retention rate with a worse picture in human services overall than in other nonprofits—though their success with top repeat donors exceeds that of others.
Complementing the benchmark report is a free tool, the FEP Fundraising Fitness Test. This Excel spreadsheet allows HSOs, as well as every other kind of charitable organization, to analyze their own gift transactions to create benchmark statistics about fundraising effectiveness.
Unsurprisingly, larger organizations receiving total annual donations of $2.5 million and up are better at retaining donors. Smaller organizations excel at the less profitable endeavor of surfacing new donors.
The Giving USA Philanthropy Spotlight, “Benchmarking Giving to Human Services,” can be downloaded for $19.95 at www.givingusa.org. For more information and access to the free, downloadable FEP Fundraising Fitness Test, visit www.afpfep.org.