
This article comes from the spring 2020 edition of the Nonprofit Quarterly. It’s part of a special series of articles about the impending recession and how nonprofits are likely to be affected. The full issue of the Quarterly contains the data and methodology used to construct this work. Please also see “On COVID-19, the Recession, and Nonprofits: A Special Series” and “Deconstructing the (Not-So-Great) Nonprofit Recession.” This article was modified on April 11, 2020.
We have taken the extraordinary step of changing this article at the last minute before it is released, because the context for it has changed radically; where a month ago we were speculating about the possibility of an imminent recession, we are now descending into a downturn that may be likely have the depth of a depression. The coronavirus and our federal government’s lack of preparedness has resulted in wide shutdowns of business and community infrastructures and massive unemployment, even as we struggle at the last minute to find the supplies we need to test people, protect frontline workers, and treat the sick and dying. Within a matter of weeks, this country is succumbing to a miasma that is moving at high speed and causing untold damage.
These kinds of mass events have the tendency to surface preexisting fault lines in our communities, and one of these fault lines is in this democracy’s inability to care for itself properly. This is, in large part, the responsibility of nonprofits, where people gather to attend to the interests of those with less voice; but do nonprofits play that role?
Our investigation of the last recession reveals, in short, that the nonprofit sector fared relatively well during and following that period. As we write this, we understand that some may be thinking, “Well, don’t tell them that!” But the facts are the facts: The nonprofit sector, as a collection of institutions, fared well, while its most vulnerable constituencies lost ground—and that should raise questions about this sector’s function and focus in society, even given that not all nonprofits work on issues of equity, justice, and democracy.
That said, the data have revealed a number of interesting findings and patterns not only about specific fields but also about the sector in general, and that overall pattern is one of enviable institutional agility and resilience even as the overall economy has become increasingly stratified.
Overview
We looked at the effects of the recession on nonprofits in a number of different ways, examining
- changes in contributed revenue;
- changes in program service revenue;
- changes in assets; and
- changes in the proportions of income that were derived from contributed versus earned revenue.
We broke these down by category of nonprofit, and compared the gains and losses across fields. (For more details, see the “Data and Methodology” sidebar on pages 16–20 of the full issue of the Quarterly.) These data do not recognize, however, the details of what achieving resilience required of organizations as the recession hit, and in its wake. These are contained in thousands of small dramas that NPQ documented in story form over the years. We have mixed all of these informational streams here to
- reinforce the understanding that, according to the hard data, nonprofits are excellent and highly adaptive managers when it comes to running complex organizations, even in financial downturns—and this advantage will only improve as we examine and reflect on our still-underused capacities;
- detail the realities of the last downturn, to help nonprofits prepare for the current situation; and
- emphasize that, while this will undoubtedly be a very challenging time for nonprofits, the sector has in the past seemed to devote more attention to its own sustainability than to its stakeholders, so nonprofits need to keep a close eye on meta-policies affecting the long-term resilience of the communities we serve.
Top-Line Findings
When we look at the effects of the recession on the various National Taxonomy of Exempt Entities (NTEE) categories of nonprofits,1 we can sense that for each category, preexisting trends and dynamics were often interacting with the downturn to create the outcomes for various particular types of organizations. For instance, many arts organizations make large capital outlays on spec, because that is how their enterprises work; but as a precommitted large capital outlay met a newly financially cautious audience and donors—along with the sudden underperformance of endowments (where they existed)—one saw many symphonies, operas, repertory theaters, and museums in panic mode. These preexisting field-specific dynamics, coupled with the character and sources of the recession, were playing out in a plethora of ways that resulted in the landscapes evident in the data. (Note: All the data and analysis that follow are the authors’ own unless otherwise noted; see the “Data and Methodology” section on pages 16–20 of the full issue of the Quarterly for details.)
- Some nonprofit organizational types never fully recovered, while others ended up in better shape after the recovery (and even immediately postrecession). For most categories of nonprofits, dips in overall revenue were felt most acutely in 2009; but the depths of the dips and the trajectories of recovery, which we define here as occurring between 2010 and 2015, varied widely.
- What we can assume right now is that, overall, larger nonprofits ended up gaining ground while smaller nonprofits lost ground during and after the recession. This assumption is based on the finding that “eds and meds”—institutions of higher education and hospitals and healthcare organizations—gained 27.6 percent in assets over the recession and recovery period (fiscal years 2007 through 2015, controlling for inflation), while other nonprofits—taken as a whole—gained only 12.3 percent. Eds and meds—which, speaking in terms of assets, made up 55.9 percent of the sector in 2015—saw only a 1.2 percent loss of assets during the recession; meanwhile, other types of organizations saw a 3.7 percent loss of assets during the recession.
- Most non-eds-and-meds saw their revenues decline during the recession, but health organizations (not in the category of meds) and human services organizations were the exception. Excluding the eds and meds, total revenues declined by 1.6 percent in inflation-adjusted dollars between 2007 and 2010, the period covering the recession. The two categories where overall revenues increased were health organizations (excluding hospitals, i.e., meds), where revenues increased by 6.6 percent, and human services organizations, where revenues increased by 6.3 percent. Between 2007 and 2010, human services organizations (37.9 percent of public charities during 2007, not counting the eds and meds) saw a remarkable 15.2 percent increase in contributions. However, contributions to human services organizations increased at a lower rate than other public charities during the postrecession years, increasing by only 1.0 percent between 2010 and 2015.
- Eds and meds continued to grow their revenues through the recession, but not through contributions. Overall, contributions to non-eds-and-meds public charities increased by 1.4 percent during the recession years, while contributions to eds and meds decreased by 11.8 percent during the same period. In fact, program service revenues for the eds and meds—which constituted 88.8 percent of total revenues in fiscal 2015—increased by 9.5 percent between 2007 and 2010, enabling eds and meds to realize a gain of 2.8 percent in total revenues during the recession. This suggests that the availability of capital in larger and more monied organizations helped build those revenue streams.
- Although the closure rate for public charities was slightly higher during the recession than immediately before or after the recession, new nonprofits continued to emerge even as others shuttered. To measure yearly organizational closures during and after the recession, we took the 2007 sample (organizations that reported financial data during fiscal 2007) and counted the number of organizations that disappeared from the sample in a given year and never reappeared through 2013.2 Between 2008 and 2010, 13.5 percent of public charities (not counting eds and meds) closed, compared to 10.2 percent between 2005 and 2007 and 8.2 percent between 2011 and 2013.3 But each year showed a balancing of old and new that kept numbers of organizations fairly stable. For instance, 7.3 percent of organizations in our sample that reported revenues for fiscal 2008 had no data for 2009—either because they closed, lost their public-charity status, failed to file a return, or slipped below $100,000 in total revenues. However, in terms of entries, 6.5 percent of organizations reporting revenue data in 2009 had no data in 2008 but reported revenues in 2009. These organizations “entered” or “re-entered” the sample—either because they had recently received tax-exempt status or because they had accumulated $100,000 or more in total revenues.
- Only environmental and human services public charities had higher “entry rates” than “exit rates” between 2008 and 2009.
- Closure rates during the recession were highest for: international, public, societal benefit; religious; and mutual/membership benefit organizations—and lowest for human services and environmental public charities.
- Closures, unsurprisingly, were higher in fields that also showed the heaviest loss of assets. The same four public-charity types with the highest closure rates: international; public, societal benefit; religious; and mutual/membership benefit organizations—along with arts organizations, were the most likely to lose a significant portion of their assets during the recession. These organizational types head the “biggest losers” group of public charities, defined as the proportion of organizations that lost 20 percent or more of their assets between 2007 and 2010. While 23.4 percent of non-eds-and-meds public charities earned the “big loser” designation, 39.8 percent qualified as “big winners” during the postrecession period, realizing an increase of 20 percent or more in total assets between 2010 and 2015.
- Over the entire period, the asset totals for human services organizations, the largest single organizational type, remained remarkably stable. Human services organizations had the lowest closure rates, the smallest percentage of “big losers,” and the smallest percentage of “big winners” among all organizational types, excluding eds and meds. In contrast, arts organizations were less likely to close, more likely to be “big losers” in terms of assets during the recession, and less likely to be “big winners” during the recovery.
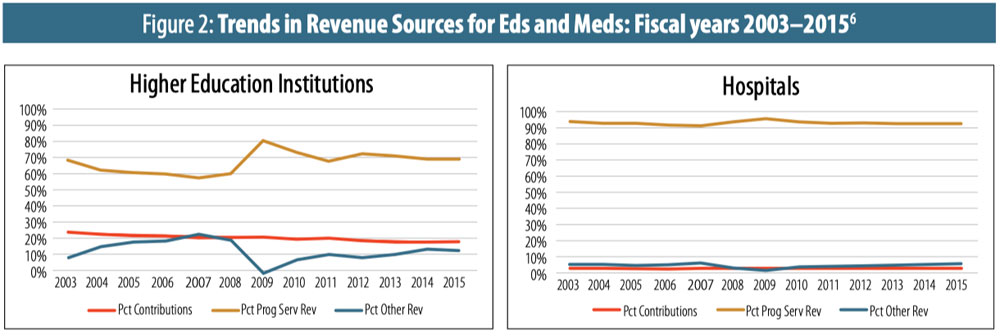
Trends in Percentage of Revenue Sources by Type of Public Charity: Fiscal Years 2003–2015
The Great Recession also affected the proportion of revenue coming from various sources for many public charities. The charts below (Figures 1 and 2) show the percentage of revenues coming from contributions, gifts, and grants; from program service revenues and membership dues; and from other sources (such as investment income). Many of the largest organizations, such as the eds and meds, were heavily reliant on revenue from commercial sources before the recession, and (if anything) even more reliant on those program service revenues during and after the recovery period.
A cautionary note as you read these charts: Because the trend lines are based on proportions of revenue rather than dollars, we should not assume that when a trend line goes up it means that there was an increase in revenue in the relevant category. However, the charts provide a sense of how the revenue mix for certain subsectors changed under externally driven financial stress.
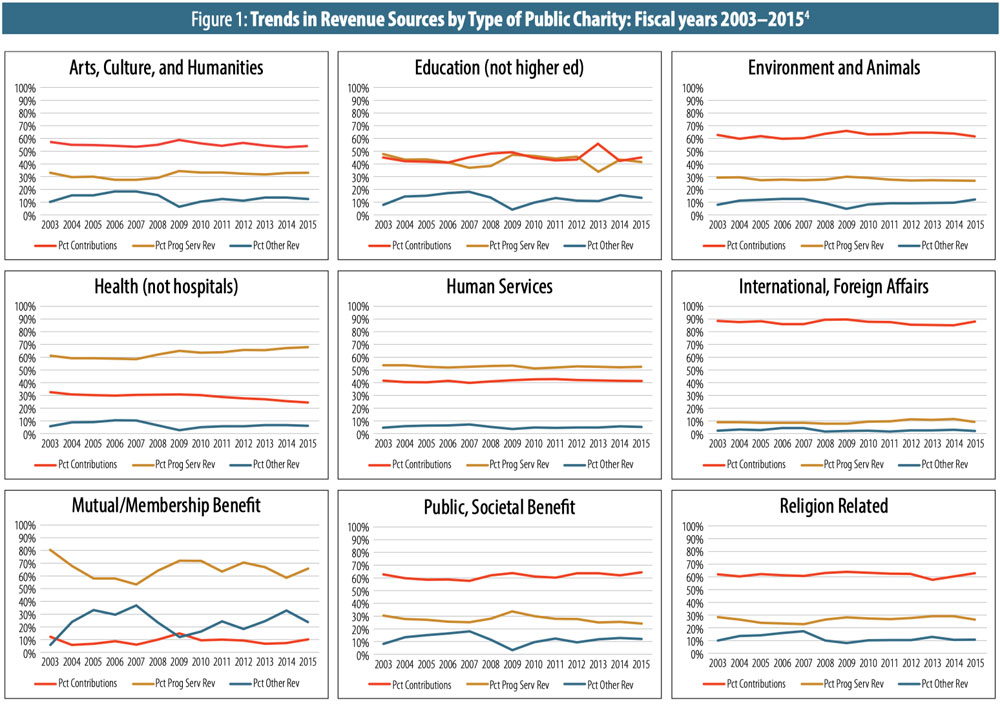
Arts, culture, and humanities are one example. In 2009, total revenues for this subsector fell by 9 percent; so, while program service revenues increased, contributions/gifts/grants dropped a little, and “other” revenues (investment income plus other, smaller revenue streams) fell sharply. The sharp drop in “other” revenues caused the percentages of revenue coming from the other two sources to rise, but revenue amounts from the other two sources did not rise by enough to cover the losses in investment income.
Thus, the charts give readers a sense of which revenue streams are most vulnerable to an economic downturn (or at least this particular downturn) and which might be seen as more immediately productive during the postrecession recovery period.
With all of this comparison of nonprofit categories, however, the most troubling big losers of all were the portions of our community who most need the support of the nonprofit and philanthropic sectors—that is, people of low and moderate income who emerged from the recession worse off in real and relative terms financially. These declines in assets and real income hit Black and Latinx communities hardest.5
Stories from Inside the Data
While nonprofits fared relatively well during the recession, their survival was not achieved without significant skill and effort, organization by organization; and for many of those groups that survived, there was no road map or time line available, which rendered strategy setting incremental, and outcomes almost impossible to predict.
Add to this the changeable interests and needs of the public, as well as the risks many organizations take advisedly during the regular course of business and during growth, and one sees some organizations hit harder than others.
Below are two stories of organizations that took the risk of making an outlay of capital based on their best understanding of the environment, only to be blindsided by the downturn. One of the vignettes comes from the arts, where such outlays are made as a matter of course; the other comes from an organization in growth mode whose cornerstone funder went belly-up.
The Case of the San Jose Repertory Theatre
Some arts organizations make capital outlays regularly on spec, projecting on the basis of what they know to be likely from experience. But the suddenness of the downturn caught many mid-project—that is, they made a capital outlay only to find that (1) people were not buying tickets, in order to conserve household budgets, (2) donors became less generous, and (3) state or city contributions dried up in favor of more pressing human needs. Some groups began to dip into their own endowments, and at some point faced overall sustainability questions. The angst became existential: Was the problem the economy, or was their art a dying form? In March 2009, NPQ wrote:7
The San Jose Repertory Theatre in San Jose, California, is one of the anchoring cultural institutions of San Jose’s downtown core. Along with many other live theaters in the country, it struggled with its business plan of late, and the business plan has everything to do with knowing and addressing the interests of the local audience.
“This is not a ‘roadhouse’” says Christa Stiner, the organization’s chief financial officer in a 2009 interview with NPQ. “When we present a show, it is almost always ours, self-produced.” Stiner is part of a reconstruction team that took over the theater after the city, which owns the building housing the theater, intervened in the institution’s discussions about possible closure. “That’s when the city of San Jose said, ‘We can’t afford to have this theater go dark,’” Stiner says. “They came in with a $2 million line of credit, $550,000 of which immediately went to pay past-due payables.” Another $250,000 has shored up declining donations. The line of credit has given the institution some breathing room within which it has reorganized its cost structures and revitalized interest among its audience and donors.
Despite the theater’s progress, the economic downturn comes at a difficult time for it. And Stiner has been “visited” by a local ghost that stands as a kind of cautionary tale for theatrical risk taking and good management.
In December 2008, the city’s 75-year-old American Musical Theatre, which had nearly twice the annual budget of the repertory theater, went bankrupt and closed. “I looked at their 990s online at GuideStar—just to understand what happened,” Stiner says.
They had been running some pretty dramatic deficits. They were in a negative asset position to the tune of $2 million, so they had been missing their revenue goals for quite some time. But what pushed them over the edge was a partnership. They had sent $225,000 to a coproduction partner that used the money for its own operating expenses rather than to build the show, so not only were they out the $225,000, but they did not have anything for that slot in the season. They didn’t have the money to refund subscribers or single-ticket buyers: a debt of approximately $800,000. The whole loss was reported to be somewhere around $1.7 million. They just closed.
But as they try to avoid a similar fate, the administrators of the theater have not been abandoned. The finance department of the city monitors the theater carefully, reviewing its financials on a monthly basis. The theater’s finance committee has “some of the brightest brains in Silicon Valley on it,” Stiner says. “These people are very engaged. They know how we got into trouble in the first place, and they are set on making sure that we get out of trouble now.” Still, there is no doubt that the theater is walking a fine line.
At the time of NPQ’s interview with Stiner, the theater had cash-flow concerns, a debt of $2.7 million, and an endowment of $1 million. The article continued:
Very much in wait-and-see mode, Stiner reports that subscription renewals have decreased about 8 percent compared with the previous year (which represented a contraction over the prior year). Luckily, the theater had projected a low enough goal so it is not yet far off its budget, but over the coming months, the subscription component will be a high-tension waiting game. Contributions have also declined, but at the lesser rate of 9 percent.
On the hopeful side, the theater was getting ready to stage the first-ever live performance of Khaled Hosseini’s Kite Runner, for which tickets are selling well, and will follow up that show’s run with the musical production The 25th Annual Putnam County Spelling Bee. “If that does well,” remarks Stiner, “we could earn our way out of a large chunk of our debt. We could run a significant surplus even at 60 percent capacity, and that’s my best-case scenario.
“The worst-case scenario is that nobody will want to see either production, and we will have spent our deferred revenue, and our line of credit will be fully extended. It’s not even that we will have made bad business decisions, but we will have squandered everything we have done in the past three years to turn the place around.”
In 2014, the theater declared Chapter 7 Bankruptcy, and closed.
Other dynamics were at play during this period. For a number of symphonies and orchestras, cutbacks on labor costs led to organizational strife and worry that the art form was dying or already dead.
Sign up for our free newsletters
Subscribe to NPQ's newsletters to have our top stories delivered directly to your inbox.
By signing up, you agree to our privacy policy and terms of use, and to receive messages from NPQ and our partners.
The Case of Higher Achievement
The arts were not the only sector where one saw such dynamics. Other individual groups experienced these kinds of existential moments midgrowth when they made capital outlays on the assumption of a stable economy. Higher Achievement was a youth organization in Washington, D.C., with ambitious plans and a carefully laid base of support from funders, when it ran headlong into its own perfect storm: the recession, paired with a direct hit from Bernie Madoff’s Ponzi scheme. In 2009, NPQ wrote:8
Higher Achievement is a 33-year-old organization that provides rigorous year-round academic enrichment to middle-school students in the Washington, D.C., area. But the organization’s age and history come with a caveat: in 1998 it was pretty much pronounced dead. It ceased operations; and at the time it was $300,000 in debt. Still, Maureen Holla, a volunteer in the program when it went under, did not give up hope, and in 1999, as its new executive director, Holla reopened the program.
Richard Tagle, the current executive director, has been at Higher Achievement since mid-2006, and at that time the organization had established four sites in Washington, D.C., and was about to launch a fifth, in Virginia. “When I came in, the organization had a budget of $1.6 million and a staff of 18. A lot of our funding was garnered from local foundations and corporations.” Since Tagle took the helm, Higher Achievement has expanded into Baltimore.
In the two years since, Higher Achieve ment’s budget has grown to $4.7 million annually, but some of this growth is allocated toward onetime costs associated with what was originally an aggressive replication plan as well as a longitudinal study. First priced at $20 million, that replication strategy has now been scaled back to a more measured expansion plan, priced at $11 million. The difference between the two is the number of sites to be established by 2020 and the nature of the partnership agreement between Higher Achievement and the sites. The sites will now be required to invest more cash in implementation. In terms of the organization’s base program, Tagle estimates that approximately $2.3 million is slated for direct service at each fully scaled affiliate, and the rest is meant to capitalize expansion to other cities.
Higher Achievement has experienced a downturn in revenue, but also success in exploring new avenues. These triumphs and setbacks come in bits and pieces. Over the past three years, Freddie Mac has contributed $250,000 a year; Fannie Mae had been giving $50,000, but this year gave none. And individual and foundation funding to the base program has probably decreased 20 percent to 25 percent, but on the other hand the organization has managed to offset that with new corporate contributions (mobilized by the board) and some newly available Department of Education money as well as increased attention toward public revenue streams, such as Title I and 21st Century Community Learning Centers.
During the economic crisis, Higher Achievement has experienced its dramatic moments.
“We needed a little over $1 million to finish the funding for a multiyear study we were doing on our outcomes, and the Atlantic Philanthropies basically introduced me to the Picower Foundation. I had had a number of meetings with them, after which they asked me to submit a proposal, and we got approved for a $750,000 grant, so I went away on vacation feeling good.
“I was going to Asia. I was in a hotel room in Hong Kong when I saw I had a voicemail, and basically it was a message from Barbara Picower saying that their endowment money—all $1.2 billion of it—was invested with [Bernard] Madoff. The foundation would close. She was very sorry. My response—all alone in my hotel room in Hong Kong—actually drove the people in the next room to come knocking to see if I was OK.
“And of course I had based other asks on this funding coming through, and so of course this would cause them to look at our requests differently. It was tough.”
Higher Achievement is always measuring risk. “When we opened Baltimore, we knew that we had enough money for 24 months, but it’s a risk,” Tagle says. “We have a whole document that looks at the potential risks of opening a new site. There are also risks associated with enlarging staff and in putting money into systems and procedures in preparation for expansion when funding is in the state that it’s in. So the board and I are in constant conversation—much more so than previously. We are all trying to gauge the timing, because the economy is going to turn around sometime, and we want to be right in the line of view of people with money when that begins to happen.”
As NPQ finished the report, Higher Achievement was in good shape, with “a healthy pot of reserves, expectations of an operating surplus for 2009, and a strong base program” that Tagle said was being protected from any changes in the organization’s national strategy. “It’s most important for us to deliver great results for our scholars. Everything else flows from that, so it’s important that staff does not become distracted,” he said.9
And, indeed, staff did not become distracted. In a recent call with CEO Lynsey Wood Jeffries ten years later, Jeffries described an organization that has stayed firmly on track even as it has negotiated the vicissitudes of funding and strategy. For Higher Achievement, its strength was in its results with students, and its traction was ensured by the rigorous evaluation of those results. Jeffries revealed that the organization has just completed a second major study of its outcomes, which is due to be published in June 2020 by MDRC. And, although a $12 million federal grant is ending relatively soon, the organization has worked hard to attract money from other levels of government and from large donors, and does not expect any severe curtailment of its programs. And, despite the fact that the model is attractive to other locales, Higher Achievement has resisted the temptation to expand into too many cities, instead opting to go deeper in the four cities it is in.
Thus, Higher Achievement is a good example of an organization that has stayed true to a mission-based model even while strategies and funding have changed. It has adjusted its work over time in accordance with findings, and plans to continue to prove its model student by student.
Both the San Jose Repertory Theatre and Higher Achievement had a set of variables that flowed from different aspects of their identity, including where they were located, who funded them, and whether their work was in fashion or was a high priority to funders. It’s important that organizations think about and monitor such aspects as the country faces a new recession. There is no one checklist or model.
Fieldwide Problems That Flowed from the Character of the Recession
There were some fields that were affected by the specific character of the recession, and for these groups the ups and downs were quite intense. In the case of housing groups, funding streams changed, and activity intensified as needs intensified even more;10 but other types of groups were intensely affected by the specific character of the recession, as well.
Legal services, charged with helping people with benefits questions, saw its own perfect storm: an increase in calls for services coupled with a lack of money from public escrow funds generally earmarked for them. This had to do with the particular cause and character of the recession—the housing market slowed to a crawl and the usual flow of escrow funds dried up, cutting off the field’s major common source of funding.11
This was extended into the aftermath of the recession, as NPQ noted in 2014:
As NPQ has reported on a number of occasions, civil legal aid is in significant part paid for by the Interest on Lawyers’ Trust Accounts (IOLTA). This is derived from, among other things, the interest paid on money that lawyers hold in trust for clients during real estate transactions. That money was precipitously eroded, first by the decline in the housing market and then by today’s historically low bank interest rates. In 2007, before the big recession, that fund generated nearly $32 million in interest; this year, only $4.5 million is expected to be generated.
While we hesitate to give predictions or analysis at so early a stage in the current situation, it seems clear that this time around nonprofits are likely to experience the kinds of unemployment trends that were feared, but did not happen, during the Great Recession. The proximate cause last time was a fraud-based housing bubble, which had a huge ripple effect in most areas of life but did not bring daily activities to a standstill. This time, we appeared to be on the cusp of a probable recession without a clear-cut cause when the pandemic hit, resulting in a massive global shutdown of society. This means, among many other challenges, that nonprofits dependent upon performance-based contracts will experience an immediate plunge in their revenues.
About Recession-Related Giving Patterns
While giving dipped during the depths of the recession, it rebounded relatively quickly (see Figure 3)—or at least on par with recoveries from previous downturns—but it also came back differently, with larger donors taking up more space.
Concurrently, as we now know, households of more limited means were giving less, and that trend has continued its downward trajectory ever since, according to Dr. Patrick Rooney of the Indiana University Lilly Family School of Philanthropy, who surfaced this decline in 2018 and updated that data in 2019.
In 2016, 53.9 percent of American households donated something to a legally recognized charity. This is down 1.5 percentage points from the prior wave of data in 2014, 11.5 percentage points since the Great Recession, and almost 14 percentage points from the peak level, in 2002. In other words, one in five former donors in the early waves of the study are now not giving anything to legal charities in any given year….
Meanwhile, big donors are playing an even bigger role than in earlier years. First, itemized giving by those with an adjusted gross income (AGI) of $1 million or more in any given year has grown dramatically over the last couple of decades.12
Thus, the giving recovery reflected to some extent the overall recovery from the recession, with larger-dollar donors comprising more of the recovery than donors of small to midsized gifts.
In 2019, the Association of Fundraising Professionals released the most recent edition of their enormously useful Fundraising Effectiveness Survey Report.13 This report suggests that for many small organizations, the recession appears to have had a lingering effect on their ability to raise funds from private donors. Larger organizations, however, were able to maintain relationships with donors even if those donors were not currently giving.

Unsurprisingly, smaller charities saw donor retention suffer during and in the aftermath of the recession. In 2018, organizations raising more than $500,000 saw an average gain of 9.5 percent in their net giving levels, while those raising $100,000 to $500,000 experienced more modest gains of 3.4 percent. Those raising less than $100,000 had significant net losses, losing 9.6 percent of their 2017 contributions in 2018. In other words, small organizations lost fundraising muscle while large organizations retained it.14
The Biggest “Losers”
Even as many nonprofit organizations emerged from the Great Recession without serious long-term losses, the majority of those they serve did not. The data in Figure 4 point to a recovery that benefited the few, while assets and financial ground lost by the many have stalled in relative terms, or even continued to decline.
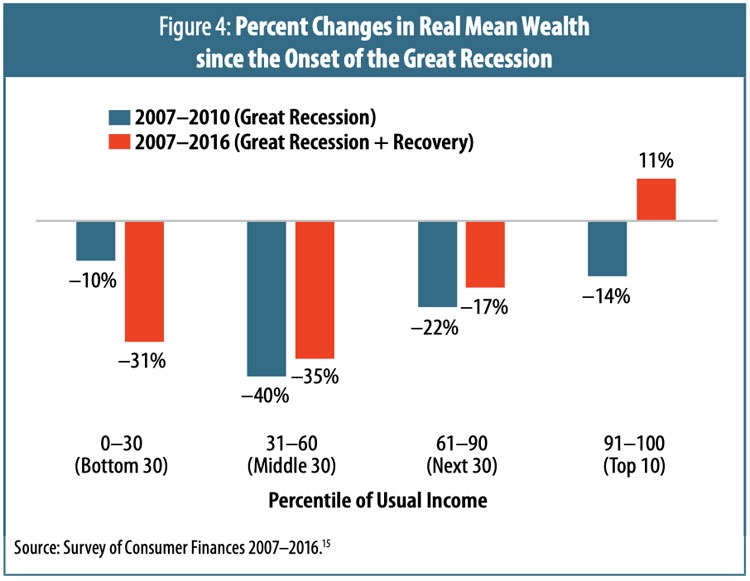
This suggests that the sector was perhaps too focused on the recovery of its own institutions with respect to longer-term fiscal health, instead of on the longer-term recovery and advancement of the financial well-being of its constituents. While we do not suggest that this sector in any way ignored the immediate needs of its communities during the depth of the last downturn, we do conclude that by remaining inactive on tax and regulatory policies, the sector has enabled an economy that is increasingly regressive and threatening to our democracy and the well-being of present and future generations.
One of the laws of systems is that “morality is foresight”—and through that lens, our moral compasses look less than fully functional.
The authors thank Jon Pratt, Kari Aanestad, and River Fiocco for their invaluable contributions to this article.
Notes
- See Deondre’ Jones, “National Taxonomy of Exempt Entities (NTEE) Codes,” Urban Institute National Center for Charitable Statistics, last modified April 2, 2019.
- A public charity can retain its tax-exempt status even after not filing its 990 for two consecutive years. Therefore, because the NCCS Core Trend files only have data through fiscal year 2015, we are unable to identify public charities that closed after 2013.
- Data taken from the NCCS Core Trend files for public charities. See the “Data and Methodology” section of the full issue of the Quarterly for more details.
- Ibid.
- See James H. Carr, “Why Recovery from the Great Recession Favored the Wealthy: The Role of Public Policy,” in this issue.
- Data taken from the NCCS Core Trend files for public charities. See the “Data and Methodology” section of the full issue of the Quarterly for more details.
- The editors, “San Jose Repertory Theatre: San Jose, California,” in “High Anxiety,” Nonprofit Quarterly 16, no. 1 (Spring 2009); published online March 21, 2009. (Reproduced with minor edits.)
- The editors, “Higher Achievement: Washington, D.C.,” in “High Anxiety.” (Reproduced with minor edits.)
- Ibid.
- See Rick Cohen, “A CDC Struggles amid Recession,” Nonprofit Quarterly, May 25, 2010.
- See Lonnie Powers, “Tied to the Railroad Track Once Again: The Perils of Legal Aid Funding,” Nonprofit Quarterly, February 23, 2011.
- Patrick M. Rooney, “Where Have All the Donors Gone? The Continued Decline of the Small Donor and the Growth of Megadonors,” Nonprofit Quarterly 26, no. 4 (Winter 2019): 20–31.
- Bill Levis et al., 2019 Fundraising Effectiveness Survey Report (Arlington, VA: Association of Fundraising Professionals, March 2019).
- Ibid.
- “Percent changes in real mean wealth since the onset of the Great Recession,” in Lisa Dettling, Joanne Hsu, and Elizabeth Llanes, “A Wealthless Recovery? Asset Ownership and the Uneven Recovery from the Great Recession,” FEDS Notes, Board of Governors of the Federal Reserve System, September 13, 2018.