December 12, 2020; Jackson Hole News & Guide
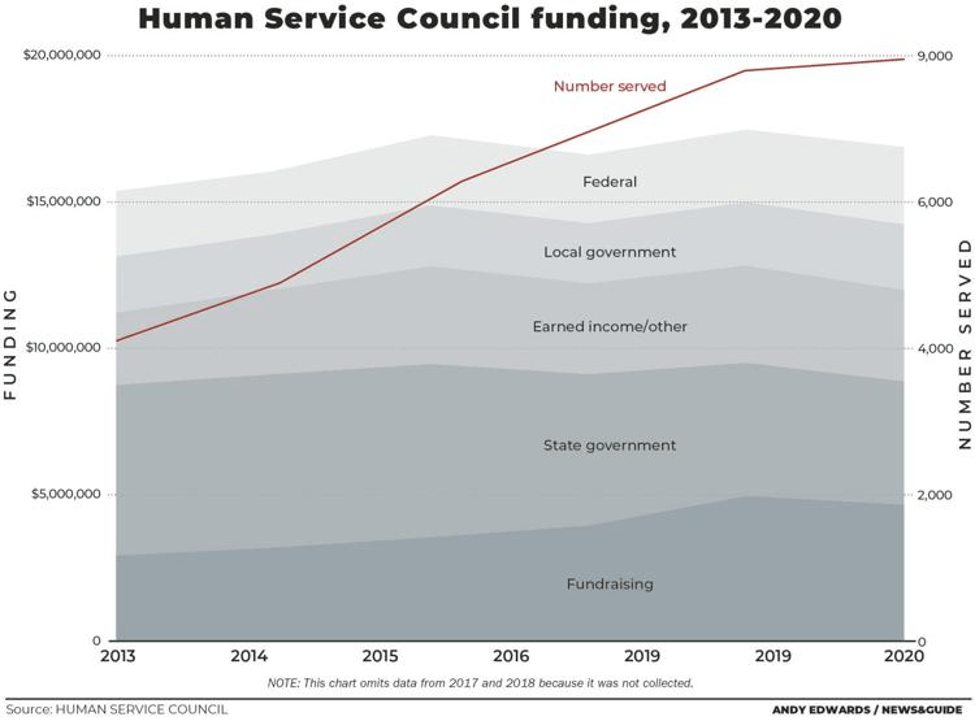
NPQ has seen a lot of anecdotes and “common knowledge” passing for real information about the state of nonprofits as we near the close of 2020. As we’ve mentioned before, these often take the form of reports that “donations are down while need is up,” even though that’s not precisely the case. Now, the Human Services Council of Jackson Hole, Wyoming, has produced an interesting chart that tries a different and perhaps more effective way to convey what’s really going on in a local nonprofit economy, taking into account the amount that is actually contributed by donations versus state, local, and federal government income and earned income.

Sign up for our free newsletters
Subscribe to NPQ's newsletters to have our top stories delivered directly to your inbox.
By signing up, you agree to our privacy policy and terms of use, and to receive messages from NPQ and our partners.
The particular grouping of agencies referenced in this chart are the area’s ten largest human services agencies. That does make a difference in how the numbers look, but one impression is that it’s state government money that’s waning, while individual giving appears in relatively good shape. The other remarkable trend line is the one for the growth of need. (The chart is missing a few years of data and, for some reason, counts 2019 twice, but the trends are still clear).
This chart, in other words, tells a great story—at least for internal stakeholders—indicating to some extent the increases and decreases in revenue and how the rise of need is on a far steeper trajectory than anything else. This information is good for donor appeals, and it doesn’t ignore the other revenue concerns we want our supporters to weigh in on.
NPQ has repeatedly suggested that nonprofits use dashboards to reflect such trends across internal stakeholder groups like the staff, board. and managers, providing a common set of reference points. This graph is a nice addition to any such endeavor, whether it is for an individual organization or locality. It’s obviously not a standalone tool, but it’s a vital one to help the public and all stakeholders get literate and get effective at building revenue to meet need.—Ruth McCambridge


