May 8, 2013; HCAN Blog
2012 must have been a tough year for the CEOs of the big pharmaceutical corporations. The cumulative salaries of the CEOs of the top 11 global pharmaceutical companies jumped from $174.4 million in 2011 to $199.2 million in 2012, a one-year increase of 14.2 percent.
|
CEO Salary Expenditures Top 11 Global Pharmaceutical Companies |
|||
|
Companies |
2012 Compensation (USD) |
2011 Compensation (USD) |
|
|
Johnson & Johnson1 |
$ 40,815,368 |
$ 26,797,939 |
|
|
Abbott Laboratories |
25,118,836 |
24,010,902 |
|
|
Pfizer |
25,634,136 |
25,013,348 |
|
|
Novartis |
14,446,818 |
16,751,783 |
|
|
Eli Lilly |
14,620,633 |
16,370,094 |
|
|
Roche (Switzerland) |
13,692,375 |
12,052,545 |
|
|
Merck |
15,459,607 |
13,347,652 |
|
|
Bristol-Myers Squibb |
17,201,980 |
14,911,947 |
|
|
Sanofi (France) |
9,863,630 |
9,245,970 |
|
|
GlaxoSmithKline (UK) |
6,328,096 |
10,523,381 |
|
|
AstraZeneca (UK)2 |
16,042,992 |
5,393,000 |
|
|
Total |
$ 199,224,471 |
$ 174,418,561 |
|
1: 2012 includes compensation for two CEOs
2: 2012 includes compensation for three CEOs
Table adapted from HCAN
At NPQ, we have written unceasingly about the challenges faced by low-income people in getting affordable health care coverage, the challenges faced by nonprofit employers in maintaining health insurance for their employees, and the crowds of people who flock to free clinics for inexpensive or no-cost treatment and medications because they can’t afford coverage on the open market.
While many states are denying expanded Medicaid coverage to poor people and as Congress prohibited Medicare from negotiating price discounts with pharmaceutical manufacturers, the CEOs—just the CEOs, mind you, not other executives of these firms—received $1.568 billion in pay over the last decade, during which the 11 companies made $711 billion in profits.
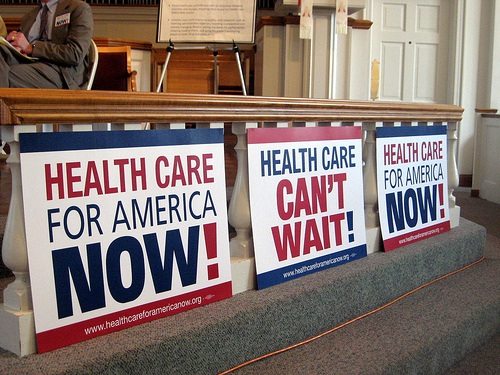
Ethan Rome, the executive director of Health Care for America Now, which compiled these numbers from public reports, takes these firms and the U.S. government to task for failing to rein in costs while their executives took home salaries comparable to the size of entire large nonprofit organizations. That’s the key for us.
Sign up for our free newsletters
Subscribe to NPQ's newsletters to have our top stories delivered directly to your inbox.
By signing up, you agree to our privacy policy and terms of use, and to receive messages from NPQ and our partners.
Nonprofits, particularly those in the health and human services arena, are struggling to meet demand at the same time as they are being crunched by rolling waves of budget cuts, the sequester, and more. Nonprofits are told by some that it is in their best interest to maximize the compensation of their own CEOs—to get paid what they’re worth, it is said—as a market measure of value. The result is that nonprofits are refraining from speaking out about corporate salaries, like the ever-fattening wallets of Big Pharma CEOs, as though it would be an argument against them taking home as much as they possibly can themselves. In advocating for better pay conditions for nonprofit leaders, one needn’t fall prey to the ludicrous argument that, so long as the markets will pay for it, anything goes.
Do we need a nonprofit-relevant measure for assessing what those Big Pharma salaries and profits mean? Look at nonprofit healthcare lobbying, and imagine how it stacks up against the lobbying of the Big Pharma companies—after the passage of the Affordable Care Act:
|
Reported U.S. Lobbying Expenditures Top 11 Global Pharmaceutical Companies ($millions) |
|||
|
Companies |
2012 |
2011 |
|
|
Johnson & Johnson |
$5.88 |
$5.81 |
|
|
Abbott Laboratories |
$6.20 |
$4.46 |
|
|
Pfizer |
$10.21 |
$12.61 |
|
|
Novartis |
$7.37 |
$6.74 |
|
|
Eli Lilly |
$11.10 |
$9.810 |
|
|
Roche (Switzerland) |
$5.32 |
$5.50 |
|
|
Merck |
$9.51 |
$8.25 |
|
|
Bristol-Myers Squibb |
$3.32 |
$3.33 |
|
|
Sanofi (France) |
$7.68 |
$8.72 |
|
|
GlaxoSmithKline (UK) |
$4.92 |
$5.45 |
|
|
AstraZeneca (UK) |
$3.57 |
$5.64 |
|
|
Total |
$75.07 million |
$76.32 million |
|
Adapted from the Center for Public Integrity lobbying database
Remember that those lobbying totals are only for the 11 firms, not for the entire industry or their national trade association, and only focus on the post-ACA years, not 2009 and 2010 when the pharmaceutical companies hit record highs in federal lobbying expenditures.
The nonprofit sector has been watching Republicans chip away at the ability to implement the Affordable Care Act, making it as difficult as possible for poor people and nonprofit employers to find affordable health care. The power of the pharmaceutical industry is a part of the structure that makes affordable healthcare as a policy goal in the U.S. seem almost ephemeral. At a minimum, nonprofits concerned about health care, social equity, and corporate profits ought to weigh in on the HCAN data to ask whether the mammoth salaries paid to Big Pharma CEOs do anything other than prevent what should be affordable health care as a right for all Americans.—Rick Cohen


