Editors’ note: This article is from NPQ‘s new, spring 2015 edition, “Inequality’s Tipping Point and the Pivotal Role of Nonprofits,” and was originally published by the Urban Institute in February 2015. The charts were designed to be interactive. Please visit the Urban Institute’s website in order to access this feature.
Why hasn’t wealth inequality improved over the past fifty years? And why, in particular, has the racial wealth gap not closed? These nine charts illustrate how income inequality, earnings gaps, homeownership rates, retirement savings, student loan debt, and lopsided asset-building subsidies have contributed to these growing wealth disparities.
1. Wealth inequality is growing.
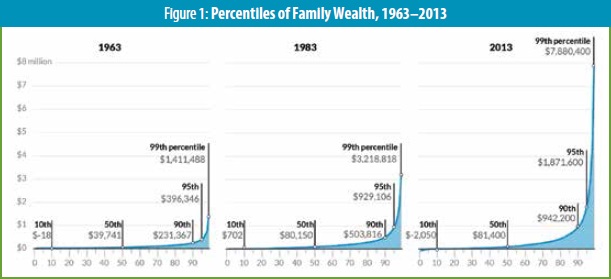
Sources: Survey of Financial Characteristics of Consumers 1962 (December 31), Survey of Changes in Family Finances 1963, and Survey of Consumer Finances 1983–2013.
Notes: 2013 dollars. No comparable data are available between 1963 and 1983.
Average wealth has increased over the past fifty years, but it has not grown equally for all groups. Between 1963 and 2013:
- Families near the bottom of the wealth distribution (those at the tenth percentile) went from having no wealth on average to being about $2,000 in debt;
- Those in the middle roughly doubled their wealth—mostly between 1963 and 1983;
- Families near the top (at the ninetieth percentile) saw their wealth quadruple; and
- The wealth of those at the ninety-ninth percentile—in other words, those wealthier than 99 percent of all families—grew sixfold.
These changes have increased wealth inequality significantly. In 1963, families near the top had six times the wealth (or, six dollars for every one dollar) of families in the middle. By 2013, they had twelve times the wealth of families in the middle.
2. One reason for rising wealth inequality is income inequality.
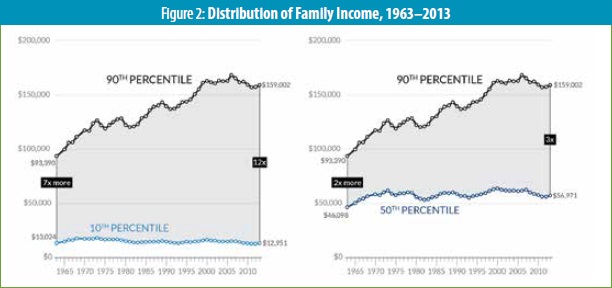
Sources: Current Population Survey 1963–2014. Calculations provided by Karen Smith, Urban Institute.
Notes: 2013 dollars. Income here is measured as private income (e.g., earnings and dividends) plus cash government benefits. Income differences narrow when all taxes and transfers—such as health insurance and in-kind government benefits—are included, but private wealth does not change.1
Income is money coming into a family, while wealth is a family’s assets—things like savings, real estate, businesses—minus debt.2 Both are important sides of families’ financial security, but wealth cushions families against emergencies and gives them the means to move up the economic ladder. Also, wealth disparities are much greater than income disparities: three times as much by one measure.
Income inequality can worsen wealth inequality because the income people have available to save and invest matters.3 Focusing on private income, such as earnings and dividends, plus cash government benefits, we see that families near the top had a 70 percent increase in income from 1963 to 2013, while the income of families at the bottom stayed roughly the same.4
3. Racial and ethnic wealth disparities are also growing.
Median wealth by race and ethnicity is lower than average wealth, but the trends stay the same (see figure 3). Both measures are important because average wealth indicates how a group is prospering as a whole relative to other groups, while median wealth shows how the “typical” family is doing.
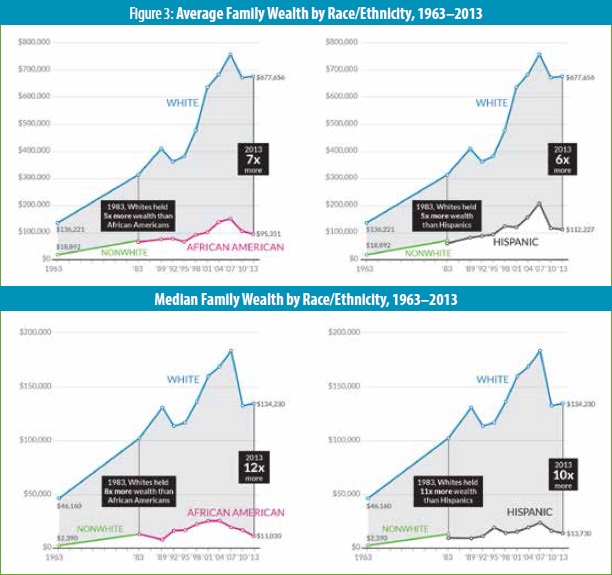
Sources: Survey of Financial Characteristics of Consumers 1962 (December 31), Survey of Changes in Family Finances 1963, and Survey of Consumer Finances 1983–2013.
Notes: 2013 dollars. No comparable data are available between 1963 and 1983. African-American/Hispanic distinction within nonwhite population available only in 1983 and later.
Families of color will soon make up a majority of the population, but most continue to fall behind whites in building wealth. In 1963, the average wealth of white families was $117,000 higher than the average wealth of nonwhite families. By 2013, the average wealth of white families was over $500,000 higher than the average wealth of African-American families ($95,000) and of Hispanic families ($112,000). Put another way, white families on average had seven times the wealth of African-American families and six times the wealth of Hispanic families in 2013. The ratio of white to African-American or Hispanic family wealth remained extremely high over this period and deteriorated in recent years.
4. The racial wealth gap grows sharply with age.
White families accumulate more wealth over their lives than African-American or Hispanic families do, widening the wealth gap at older ages (see figure 4). In their thirties, whites have an average of $140,000 more in wealth than African Americans (three times as much). By their sixties, whites have over $1 million more in average wealth than African Americans (eleven times as much).
Median wealth by race is lower. Though the dollar gap grows with age, the ratio doesn’t grow in the same way: whites have seven times more median wealth than African Americans in their thirties and in their sixties.
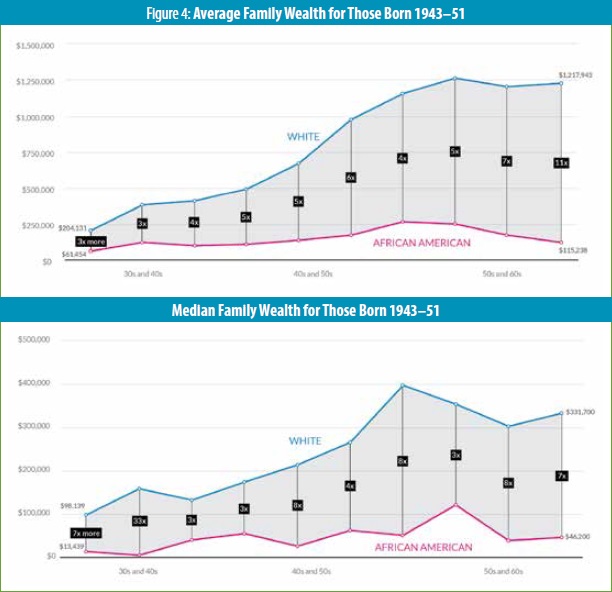
Source: Survey of Consumer Finances 1983–2013.
Notes: 2013 dollars. Hispanic sample size too small to show. Age is defined as the age of the household head. In 2013, these people were ages 62 to 70. In 1983, ages 32 to 40.
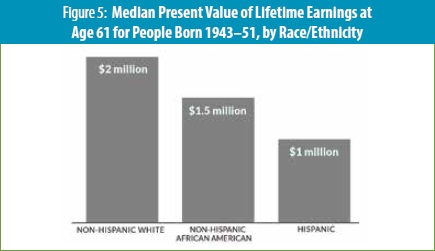
5. Differences in earnings add up over a lifetime and widen the racial wealth gap.
Why is the racial wealth gap so big? People with lower earnings may have a harder time saving. The typical white person earns $2 million over a lifetime, while the typical African American earns $1.5 million and the typical Hispanic person earns $1 million. These disparities partly reflect historical racial disadvantages that continue to affect later generations.
Source: Health and Retirement Study 1992–2012 matched to Summary Earnings Records 1951–2007. Calculations provided by Melissa Favreault, Urban Institute.
Notes: 2013 dollars. These people are age 61 in 2004–12.
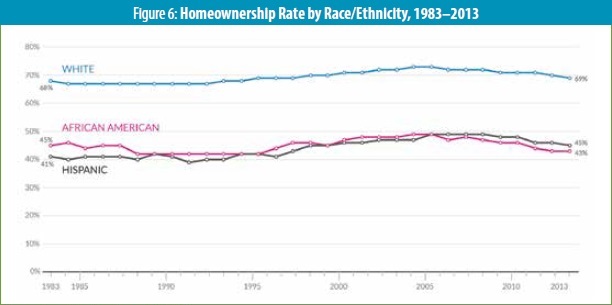
6. African Americans and Hispanics lag behind on major wealth-building measures, like homeownership.
Source: Current Population Survey 1983–2013.
Sign up for our free newsletters
Subscribe to NPQ's newsletters to have our top stories delivered directly to your inbox.
By signing up, you agree to our privacy policy and terms of use, and to receive messages from NPQ and our partners.
African Americans and Hispanics are less likely to own homes and have less in liquid retirement savings, so they more often miss out on these powerful wealth-building tools. Homeownership, in particular, makes the most of automatic payments—homeowners must make mortgage payments every month—to build equity.
In 1983, 68 percent of white families owned their home, compared with 45 percent of African-American families and 41 percent of Hispanic families. By 2013, the racial homeownership gap improved slightly for Hispanics, but it grew worse for African Americans. African Americans and Hispanics were also less likely to own homes than whites at the same income level.
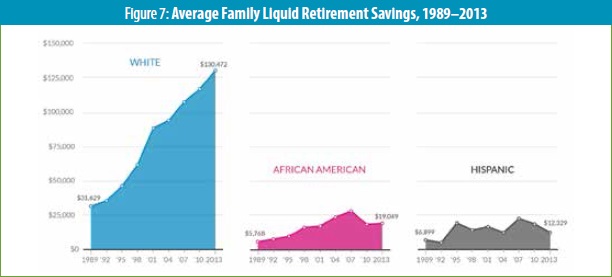
7. African-American and Hispanic families have less in liquid retirement savings.
Source: Survey of Consumer Finances 1989–2013.
Notes: 2013 dollars. Liquid retirement savings include dollars in accounts such as 401(k)s, 403(b)s, and IRAs.
Median liquid retirement savings for African-American and Hispanic families were zero from 1989 to 2013. Median liquid retirement savings for whites were zero through the mid-1990s, about $1,500 in 1998, and $5,000 in 2013.
In 2013, white families had over $100,000 more (or seven to eleven times more) in average liquid retirement savings than African-American and Hispanic families. In sheer dollar terms, this disparity quadrupled over the past quarter-century: in 1989, white families had $25,000 more (or five times more) in average retirement savings than African-American and Hispanic families. This gap is becoming more important as liquid retirement savings vehicles, like 401(k)s, replace more traditional defined-benefit pension plans.
Why does this gap exist? It’s not just income differences; even at the same income level, gaps remain. African-American and Hispanic families have slightly less access to retirement saving vehicles and lower participation when they have access. But lower access and participation isn’t the full story. Hispanic workers are less likely to participate in employer retirement plans than African-American workers but have similar average liquid retirement savings. This suggests that simply having more employers offer retirement plans will not be enough to close the gap, especially if lower-income groups contribute smaller portions of their income to retirement plans and have a greater likelihood of withdrawing money early to cover financial emergencies. Lower-income families may also get lower returns on average if they invest in safer, more short-term assets.
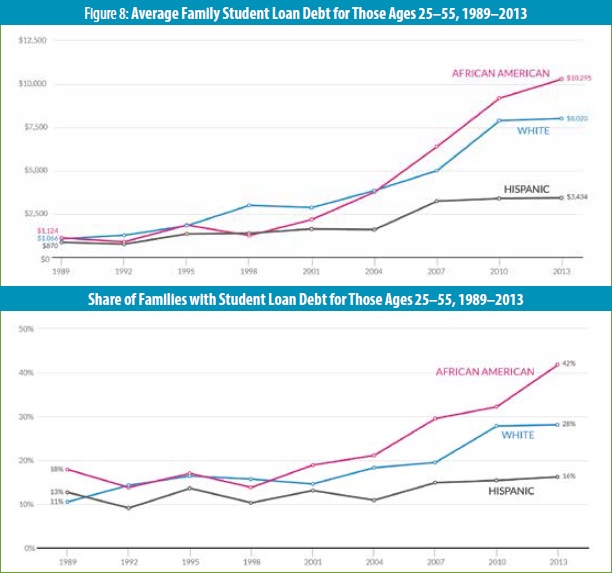
8. African-American families carry more student loan debt than white families.
Source: Survey of Consumer Finances 1989–2013.
Notes: 2013 dollars. Age is defined as the age of the household head.
Since the mid-2000s, African-American families, on average, have carried more student loan debt than white families. This is driven in large part by the growing share of African-American families that take on student debt. In 2013, 42 percent of African Americans ages twenty-five to fifty-five had student loan debt, compared with 28 percent of whites.
Because African-American families, on average, have less wealth and fewer private resources, they may be more likely to turn to loans to finance their education. White families are five times more likely than African-American families to receive large gifts or inheritances, which can be used to pay for college.5
However, African Americans also have lower graduation rates than whites, and people of color disproportionately attend for-profit schools, which have low graduation rates.6 This means that student loan debt doesn’t always translate into a degree that would promote economic mobility—and income and wealth—in the long run.
9. Federal policies fail to promote asset building by lower-income families.
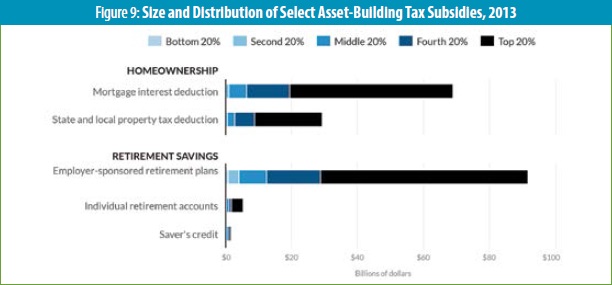
Source: Steuerle et al. (2014)7
Note: “Income” refers to the Tax Policy Center’s “expanded cash income” measure, which is described in Rosenberg (2013)8
The federal government spent $384 billion to support asset development in 2013, but those subsidies primarily benefited higher-income families—exacerbating wealth inequality and racial wealth disparities.9
About two-thirds of homeownership tax subsidies and retirement subsidies go to the top 20 percent of taxpayers, as measured by income. The bottom 20 percent, meanwhile, receive less than 1 percent of these subsidies. African Americans and Hispanics, who have lower average incomes, receive much less of these subsidies than whites, both in total amount and as a share of their incomes.
Low-income families benefit from safety net programs, such as food stamps and welfare, but most of these programs focus on income—keeping families afloat today—and do not encourage wealth building and economic mobility in the long run. What’s more, many programs discourage saving: for instance, when families won’t qualify for benefits if they have a few thousand dollars in assets or when they have to give up rent subsidies to own a home.
Promising Policies to Shrink Wealth Inequality and Racial Wealth Gaps
Federal asset-building subsidies disproportionately benefit high-income families that need them the least. Here are six recommendations that could help reduce wealth inequality and racial wealth disparities:10
- Limit the mortgage interest tax deduction and use the revenues to provide a credit for first-time home buyers.
- Establish automatic savings in retirement plans.
- Offer matched savings such as universal children’s savings accounts.
- Reform safety net program asset tests, which can act as barriers to saving among low-income families.
- Promote emergency savings with incentives linked to savings at tax time.
- Reduce reliance on student loans while supporting success in postsecondary education.
By more efficiently and equitably promoting saving and asset building, more people may have the tools to protect their families in tough times and invest in themselves and their children.
Notes
- Eugene Steuerle, “Addressing Income Inequality First Requires Knowing What We’re Measuring,” Metrotrends Blog, February 18, 2015.
- See “Frequently Asked Questions about Our Analyses of Wealth,” Urban Institute, accessed February 24, 2015.
- See Gene [Eugene] Steuerle, “Piketty, Poverty, Political Pooh,” The Government We Deserve (blog), July 24, 2014.
- Karen Smith and Emma Kalish, “Adjusting for Family Composition Increases Incomes, But the Income Gap Remains High,” Metrotrends Blog, February 20, 2015.
- Signe-Mary McKernan et al., “Do Racial Disparities in Private Transfers Help Explain the Racial Wealth Gap? New Evidence from Longitudinal Data,” Demography 51, no. 3 (June 2014): 949—74.
- National Center for Education Statistics, “Table 326.10: Graduation Rates of First-Time, Full-Time Bachelor’s Degree-Seeking Students at 4-Year Postsecondary Institutions, by Race/Ethnicity, Time to Completion, Sex, and Control of Institution: Selected Cohort Entry Years, 1996 through 2006,” Digest of Education Statistics, accessed February 27, 2015; Grace Kena et al, The Condition of Education 2014, NCES 2014-083 (Washington, D.C.: U.S. Department of Education, National Center for Education Statistics, 2014); Peter Smith and Leslie Parrish, Do Students of Color Profit from For-Profit College? Poor Outcomes and High Debt Hamper Attendees’ Futures (Durham, NC: Center for Responsible Lending, October 2014); and Christopher Avery and Sarah Turner, “Student Loans: Do College Students Borrow Too Much—Or Not Enough?,” Journal of Economic Perspectives 26, no. 1 (Winter 2012): 165—92.
- C. Eugene Steuerle et al., Who Benefits from Asset-Building Tax Subsidies?, Opportunity and Ownership Initiative Fact Sheet (Washington, D.C.: Urban Institute, September 2014).
- Joseph Rosenberg, Measuring Income for Distributional Analysis (Washington, D.C.: Urban-Brookings Tax Policy Center, July 25, 2013).
- Steuerle et al., Who Benefits from Asset-Building Tax Subsidies?; Caleb Quakenbush, “A Tax Code for a Different Time,” Metrotrends Blog, February 19, 2015.
- Signe-Mary McKernan et al, Wealth in America: Policies to Support Mobility (Washington, D.C.: Urban Institute, 2014).
The nonprofit Urban Institute is dedicated to elevating the debate on social and economic policy. This interactive was funded by the Ford Foundation, with additional support from the Annie E. Casey Foundation. Funders do not determine research findings or influence scholars’ conclusions. The team thanks Melissa Favreault and Karen Smith for special tabulations, Taz George for assistance with the homeownership series, and Opportunity and Ownership seminar participants for helpful comments. The views expressed are those of the authors and should not be attributed to the Urban Institute, its trustees, or its funders. © Urban Institute, February 2015.


