
This article comes from the spring 2020 edition of the Nonprofit Quarterly. It was updated on April 8, 2020. It’s part of a series of articles addressing the last recession and informing nonprofits and philanthropies on options for our work and advocacy agendas in the impending recession. Please also see “On COVID-19, the Recession, and Nonprofits: A Special Series,” “Deconstructing the (Not-So-Great) Nonprofit Recession,” “Nonprofits in Recession: Winners and Losers,” and “‘Four Futures’ of the Great Recession Revisited: Nonprofits’ Hopes, Fears, and What Really Happened.”
The Great Recession, which engulfed the U.S. economy in December 2007 and lasted until June 2009,1 resulted in the loss of 8.7 million jobs, an increase of unemployment from 4.7 percent to more than 10 percent,2 a decline in annual gross domestic product (GDP) of roughly 6 percent,3 and a greater than 50 percent drop in the Dow Jones Industrial Average, relative to its 2007 high.4 The housing sector, which was the epicenter of the economic collapse, experienced a 33 percent fall in home prices nationally,5 10 million home foreclosures,6 and $9.8 trillion dollars in lost home equity.7 Massive losses among housing finance–related institutions nearly triggered the collapse of the entire U.S. financial system.8 Combined, U.S. households experienced a total loss of roughly $16.4 trillion.9 As summed up by the U.S. Federal Reserve Bank, “From peak to trough, [the 2007–2009 economic downturn was] the deepest recession since World War II.”10
All demographic groups experienced a loss of wealth during the 2007–2009 recession, but lower- and moderate-income populations and people of color suffered the greatest economic damage. The Pew Research Center estimates that between 2007 and 2013, median net wealth for Latinx and Black households fell 44.3 percent and 47.6 percent, respectively. Non-Latinx white wealth fell by 26.2 percent.11 Percentage losses in wealth, however, understate the negative economic impact of the Great Recession on Black and Latinx households relative to non-Latinx white households. In 2013, the median wealth of non-Latinx white households was $142,000—thirteen times the median net worth of Black households ($11,000) and ten times that of Latinx households ($13,700).12
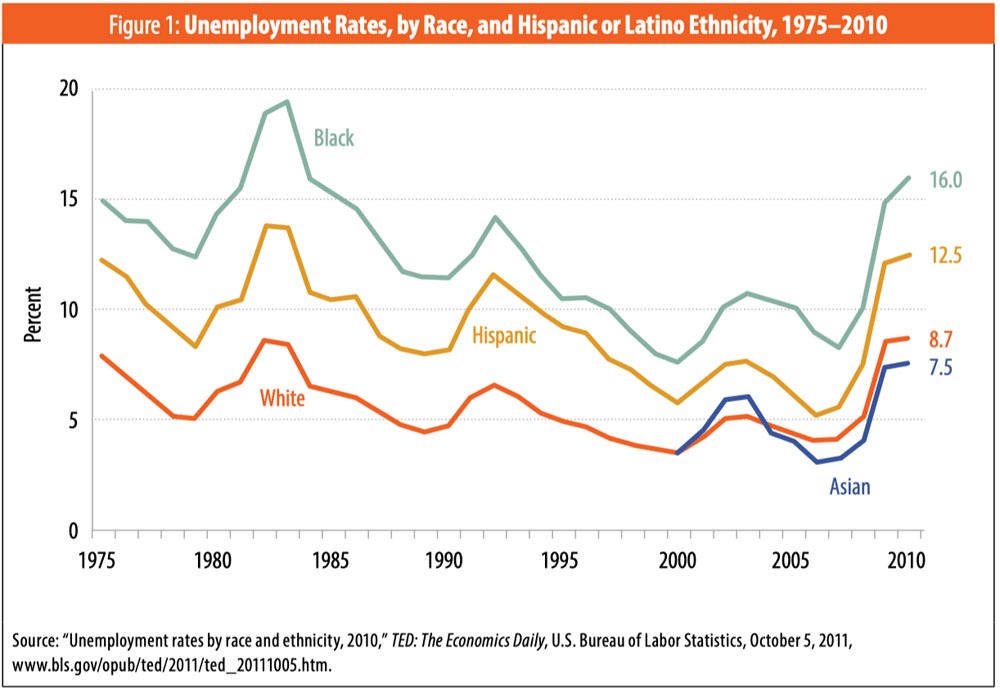
Disproportionately greater unemployment rates for Black and Latinx folks during the Great Recession contributed to higher wealth losses for those populations relative to non-Latinx whites. Unemployment for Blacks and Latinxs peaked at 16 percent and 12.5 percent, respectively. Non-Latinx white unemployment peaked at 8.7 percent. Although Asian Americans lost substantial wealth during the recession, their unemployment rate remained below that of non-Latinx whites, at 7.5 percent.13 (See Figure 1.)
Rising Wealth Inequality Postrecession
Fully a decade later, U.S. household wealth lost during the 2007–2009 recession has more than been recovered. The Dow Jones Industrial Average, for example, which fell to a low of 6,547.05 in 2009,14 is up nearly five-fold from its 2009 low—or more than 22,000 points—to 29,348 as of January 17, 2020.15 Unemployment rates are at historic lows, although those lows may be deceptive, given continued depressed labor-force participation rates.16 And although there remain pockets of weaknesses in housing markets in communities across the nation, home prices nationally exceed their 2007 levels. As of February 2018, the average house price was 1 percent higher than it was at the peak in 2006.17
Black and Latinx populations have benefited from the strong job growth and increases in wages since 2010. As with the overall unemployment rate, unemployment rates for both groups are at historic lows. The gaps in unemployment rates between Latinxs and non-Latinx whites and between Blacks and non-Latinx whites have narrowed. Yet despite the overall positive economic-recovery news for Black and Latinx households, the racial wealth gaps for those households, relative to non-Latinx whites, have over the past decade accelerated rather than narrowed.
Wage gains for non-Latinx whites, for example, have exceeded those for Blacks and Latinxs, further contributing to rising wealth inequality.18
Further, the largest source of wealth for the median American household is homeownership. Home equity is even more important for Black and Latinx households than it is for non-Latinx whites, because non-Latinx whites are more likely to have additional sources of savings, such as 401(k) plans, IRAs, lucrative pension programs, stocks, bonds, rental real-estate holdings, and other assets.
Moreover, non-Latinx white workers are more likely to have valuable employment benefits such as quality healthcare plans, employer-provided meals, transportation/commuting subsidies (such as employer-provided parking), and other perks, which allow a greater share of income to be allocated toward savings.19
Although wealth inequality between Latinx and non-Latinx whites has increased during the current recovery, Latinxs have in part recovered wealth lost during the recession,20 due in part to a recovery in home prices and a rebound—albeit not full recovery—in prerecession Latinx homeownership.
Blacks, by contrast, continue to control less wealth today than they held prior to the start of the 2007–2009 recession. The continuing lagging wealth recovery for Blacks is due largely to Black homeownership having continued to fall during the economic recovery. In fact, the homeownership rate in the second quarter of 2019 fell to a more than fifty-year low of 40.6 percent;21 in contrast, the homeownership rate for non-Latinx whites for that quarter was 73.1 percent. 22
Black households were disproportionately negatively harmed by foreclosures, having been the primary targets of exploitative subprime loans. And, in stark contrast to homes in non-Latinx white neighborhoods that have recovered in value across the income spectrum, prices for homes in Black neighborhoods remain below their prerecession highs for all owner income levels.
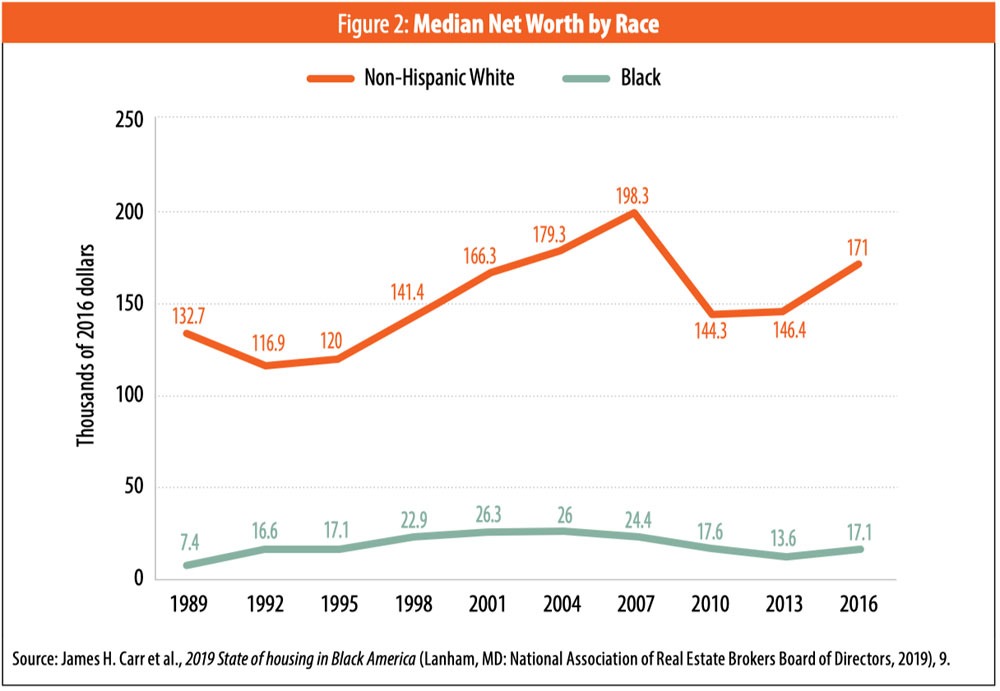
Compounding the negative reality of a lower homeownership rate for Blacks relative to non-Latinx whites, non-Latinx white households accumulate substantially more wealth in their homes, on average, than Black homeowners (see Figure 2, above).
In part, because Black homeowners, on average, purchase homes later in life than non-Latinx white homeowners, median home equity for households forty-five years or older when the home was bought is $26,668 for Black homeowners compared to $104,866 for non-Latinx white homeowners. 23
Sign up for our free newsletters
Subscribe to NPQ's newsletters to have our top stories delivered directly to your inbox.
By signing up, you agree to our privacy policy and terms of use, and to receive messages from NPQ and our partners.
The Role of Public Policy in Furthering the Racial Wealth Gap
Historically, public policy has directly and intentionally marginalized the economic mobility of people of color, including Blacks, Latinxs, and Native Americans. The role of government in undermining Black economic progress in particular has been heavily documented.24 Importantly, public policies continue to directly undermine the economic prospects for people of color in America. The failure of Blacks to recover from their economic losses sustained during the Great Recession, as well as much of the expanding racial wealth gap between Blacks and non-Latinx whites, can be attributed directly to legislation enacted to bail out the U.S. economy in 2010.
In response to the enormous financial damage resulting from the economic downturn, the federal government passed a massive, $700 billion bank bailout package known as the Toxic Asset Relief Program (TARP). Although the appropriated amount for the bank bailout was later reduced to $475 billion, Bloomberg estimated the true cost of the bank bailout to be in the trillions of dollars.25
The bank bailout proposal was initially conceived as a program that would enable the U.S. Department of the Treasury to purchase distressed home loans in order to modify them and avoid home foreclosures. As enacted, TARP included a separate, modest, poorly designed and badly implemented foreclosure mitigation program known as the Home Affordable Modification Program (HAMP).26
Most disturbing about HAMP, however, was not its programmatic shortcomings, per se, but rather its restrictions on access to program benefits. In order to participate in HAMP, home loans were required to be held by Fannie Mae or Freddie Mac. Ironically, loans held by those government agencies were among the highest-quality and lowest-interest-rate loans in the housing market, and they were largely held by non-Latinx white households. The predatory subprime loans that were at the core of the nation’s foreclosure crisis and that had been disproportionately peddled to Black households were ineligible for HAMP assistance.
Adding further to the inequity of the federal foreclosure crisis response, Congress also enacted the Home Affordable Refinance Program (HARP).27 This initiative allowed homeowners whose outstanding mortgage loans were greater than the value of their homes to refinance their mortgages at historically low rates. HARP eligibility, similar to that of HAMP, required that loans be held by Fannie Mae or Freddie Mac. The highest-cost mortgages and predatory subprime loans, disproportionately likely to be held by Black and Latinx borrowers, were ineligible for HARP assistance.
Further, the banks were being bailed out with massive cash infusions from TARP and other special lending programs designed to avoid bank failures; the borrowing rate for financial institutions from the Federal Reserve was slashed to near zero percent; and lenders being bailed out included firms that were major participants in predatory subprime lending. In fact, while the federal government eventually fined Wall Street firms more than $110 billion for a range of financial misconduct,28 it simultaneously bailed out many of those same financial firms, including providing them with near-interest-free loans.
In contrast to the tens of billions of dollars flowing to the banks, the Federal Housing Finance Agency imposed a new penalty fee on home loans in neighborhoods that had been particularly hard hit during the housing market crash. Known as the “adverse market fee” (also, the “Adverse Market Impact Fee”), this additional charge for home purchases in distressed communities further weakened the housing recovery in those communities.29 Due to the concentration of foreclosures among subprime loans in Black neighborhoods, loans for properties in Black communities were more likely to be subject to the fee than were loans to secure homes in non-Latinx white neighborhoods. The fee was suspended around 2013, but it caused irreparable damage by driving additional foreclosures in distressed communities, because owners were further limited in selling their homes.
The lack of access to HAMP and HARP and the imposition of the adverse market fee are only three of a multitude of federal actions that have directly undermined homeownership for Black and Latinx households since the Great Recession.30 In fact, the failure of federal financial regulators to rein in the abusive, high-cost, and unsustainable subprime lending was itself a public policy decision that resulted in the loss of billions of dollars in housing equity for Black and Latinx households.31
The collective result of the federal policy decisions that favored Wall Street while penalizing financially vulnerable populations of color was a massive, unearned, publicly funded wealth transfer, disproportionately from Black and Latinx, moderate- and middle-income households to wealthy banking executives and investors, who were principally non-Latinx white.
While bank bailouts and housing-related policies enacted to address the recent housing market collapse were less blatant than the post-Great Depression era’s explicitly discriminatory federal housing programs spanning the 1930s through the 1960s,32 the negative impact of more recent biased federal programs on the racial wealth gap has, nevertheless, been significant.
The Racial Wealth Gap in the Context of Broader Economic Inequality
Increasing racial inequality can also be explained in the broader context of inequality, which is greater today than it was at the time of the Great Depression of the 1930s. Today, the top 1 percent of wealthy households hold 40 percent of the nation’s wealth—up from 30 percent in 1989. During that same period, the wealth of the bottom 90 percent fell—from 33 percent to 23 percent.33 In 2018, three Americans—Jeff Bezos, Bill Gates, and Warren Buffett—controlled more wealth than the bottom 50 percent of U.S. households.34 In fact, as the top wealthy households have continued to grow their wealth, lower-income households have gone into debt.
Trade policies that favor capital ownership over labor, tax policies that tax capital gains and corporate earnings at lower rates than wage earnings, and the growing dominance of corporate monopoly ownership are major foundations of skyrocketing wealth and income inequality. Because people of color are disproportionately lower income and hold less wealth than whites, failure to address the broader issue of economic inequality in our nation will continue to fuel the racial wealth gap into the foreseeable future.
Similar to the public policies that favored failing banks over homeowners facing home foreclosures, trade, tax, and antitrust policies are not a result of the invisible hand of market competition; they are the outcome of the visible hands of elected politicians whose votes have overwhelmingly favored the further concentration of wealth in our nation. Voters hold the power to reverse the trend toward unchecked wealth inequality. The question is, What level of wealth concentration is required for the public to act?
A Future Role for Nonprofits
During the Great Recession, the nonprofit sector played a critical role in assisting needy households to access food, shelter, medical care, essential transportation, and other immediate necessities. For millions of families, the work of the nonprofit sector was lifesaving. Nonprofit organizations also provided access to foreclosure mitigation assistance to borrowers, assisting millions and helping many to maintain homeownership.
Looking forward, a major opportunity for the sector is to assist the American public in better understanding the potential impact of federal legislation on wealth and inequality in our nation. This work does not—nor should it—wait until the next economic downturn. One approach for nonprofits to achieve this goal is to assist civic associations in better understanding the wealth implications of federal legislation, as well as how best to organize and hold political leaders accountable.
The need for more effective political organizing is especially critical among financially vulnerable communities of color, whose political power is strong but whose leverage of that political clout remains elusive. Given the direction our nation is taking vis-à-vis growing economic inequity, reversing that trend could be one of the most important missions the nonprofit community takes on.
Notes
- “Consumer spending and U.S. employment from the 2007–2009 recession through 2022,” Monthly Labor Review, U.S. Bureau of Labor Statistics, October 2014.
- Kevin J. Lansing, “Gauging the Impact of the Great Recession,” FRBSF Economic Letter, Federal Reserve Bank of San Francisco, July 11, 2011.
- Alan S. Blinder and Mark Zandi, How the Great Recession Was Brought to an End (Princeton, NJ: Princeton University, July 27, 2010), 2.
- See “Dow Jones Industrial Average—Historical Annual Data” chart in “Dow Jones—DJIA—100 Year Historical Chart,” Macrotrends, accessed February 11, 2020.
- CoreLogic, Evaluating the Housing Market Since the Great Recession: Special Report (Irvine, CA: CoreLogic, February 2018), 3.
- Tommy Andres, “Divided Decade: How the financial crisis changed housing,” Marketplace, December 17, 2018.
- Renae Merle, “A guide to the financial crisis—10 years later,” Washington Post, September 10, 2018.
- Eric Rauchway, “The 2008 Crash: What Happened to All That Money?,” History Stories, History, February 1, 2019.
- Chris Isidore, “America’s Lost Trillions,” CNN Money, June 9, 2011.
- John Weinberg, “The Great Recession and its Aftermath,” Federal Reserve History, November 22, 2013.
- Signe-Mary McKernan et al., Impact of the Great Recession and Beyond: Disparities in Wealth Building by Generation and Race, Working Paper (Washington, DC: Urban Institute, April 2014), 2.
- Rakesh Kochhar and Richard Fry, “Wealth inequality has widened along racial, ethnic lines since end of Great Recession,” Fact Tank, Pew Research Center, December 12, 2014.
- “Unemployment rates by race and ethnicity, 2010,” TED: The Economics Daily, U.S. Bureau of Labor Statistics, October 5, 2011.
- Betsy Stark, “Tracking the Dow One Year After Rock Bottom,” ABC News, February 24, 2010.
- “Dow Jones Industrial Average—Historical Annual Data” chart.
- “Employment–population ratio up over the year; labor force participation rate changed little,” TED: The Economics Daily, U.S. Bureau of Labor Statistics, March 13, 2019.
- CoreLogic, Evaluating the Housing Market Since the Great Recession, 4.
- “Nine Charts about Wealth Inequality in America (Updated),” Features, Urban Institute, October 5, 2017.
- Thomas Shapiro, Tatjana Meschede, and Sam Osoro, “The Widening Racial Wealth Gap: Why Wealth Is Not Color Blind,” in Reid Cramer and Trina R. Williams Shanks, eds., The Assets Perspective: The Rise of Asset Building and its Impact on Social Policy (New York: Palgrave Macmillan, 2014).
- Edward Wolff, “The decline of African-American and Hispanic wealth since the Great Recession,” VOX: CEPR Policy Portal, December 23, 2018.
- James H. Carr et al., “Exhibit 1: Homeownership Rates 2000-2017,” 2019 State of housing in Black America (Lanham, MD: National Association of Real Estate Brokers Board of Directors, 2019), 8; based on author’s calculations of data from United States Census Bureau, “Housing Vacancies and Homeownership (CPS/HVS): Annual Statistics: 2018 (Including Historical Data by State and MSA).”
- Carr et al., 2019 State of housing in Black America, 7.
- Jung Hyun Choi, Alanna McCargo, and Laurie Goodman, “Three differences between black and white homeownership that add to the housing wealth gap,” Urban Wire (blog), Urban Institute, February 28, 2019.
- See, for example, James H. Carr and Nandinee K. Kutty, eds., Segregation: The Rising Costs for America (New York: Routledge, 2008); Douglas S. Massey and Nancy A. Denton, American Apartheid: Segregation and the Making of the Underclass (Cambridge, MA: Harvard University Press, 1993); Ira Katznelson, When Affirmative Action Was White: An Untold History of Racial Inequality in Twentieth-Century America (New York: W. W. Norton, 2005); and Richard Rothstein, The Color of Law: A Forgotten History of How Our Government Segregated America (New York: Liveright, 2017).
- Karen Weise, “Tallying the Full Cost of the Financial Crisis,” Bloomberg, September 14, 2012.
- Neil Barofsky, Bailout: An Inside Account of How Washington Abandoned Main Street While Rescuing Wall Street (New York: Free Press, 2012).
- James Chen, “Home Affordable Refinance Program (HARP),” Investopedia, May 30, 2018.
- Christina Rexrode and Emily Glazer, “Big Banks Paid $110 billion in Mortgage-Related Fines. Where Did the Money Go?,” Wall Street Journal, March 9, 2016.
- James H. Carr, Michela Zonta, and Steven P. Hornburg, Fifty Years of Struggle: Successes and Setbacks Since the Release of the Report of the National Advisory Commission on Civil Disorders and Enactment of the 1968 Fair Housing Act (Lanham, MD: National Association of Real Estate Brokers Board of Directors, 2018).
- For a lengthy discussion of biased federal policies since the onset of the Great Recession, see James H. Carr et al., 2016 State of Housing in Black America (Lanham, MD: National Association of Real Estate Brokers Board of Directors, 2016).
- See, for example, Kathleen C. Engel and Patricia A. McCoy, “A Tale of Three Markets: The Law and Economics of Predatory Lending,” Texas Law Review 80, no. 6 (May 2002): 1255–1381; and C. Bailey King Jr., “Preemption and the North Carolina Predatory Lending Law,” North Carolina Banking Institute 8, no. 1 (2004): 377–98.
- James H. Carr and Katrin B. Anacker, “The Complex History of the Federal Housing Administration: Building Wealth, Promoting Segregation, and Rescuing the U.S. Housing Market and the Economy,” Banking and Financial Services Policy Report 34, no. 8 (August 2015): 10–18.
- Greg Leiserson, Will McGrew, and Raksha Kopparam, “The distribution of wealth in the United States and implications for a net worth tax,” Washington Center for Equitable Growth, March 21, 2019.
- “Wealth Inequality in the United States,” Facts, Inequality.Org, accessed February 17, 2020, inequality.org/facts/wealth-inequality/.