

July 24, 2018; Brookings Institution
Geography may be the source of great inequity in how effective SNAP, the Supplemental Nutrition Assistance Program—better known as “food stamps”—is in its goal of diminishing food insecurity for those living in deep poverty.
According to a Brookings Institution article by Hilary Hoynes and James Ziliak, “The price of food varies widely across different locations…. In places with higher food prices, rates of household, adult, and child food insecurity are higher.”
In a separate report from the Hamilton Project, entitled Modernizing SNAP Benefits, Ziliak suggests that equalizing SNAP benefits geographically would reduce food insecurity, improve outcomes, and be cost-effective. Understanding how geography impacts this oft-assailed yet highly effective federal program may help to unravel why a change would be beneficial.
A family or individual SNAP allotment is based on a formula that hasn’t been updated since 2006. This alone should signal that it’s time to look at how this program calculates its allocations. Here is how it works:
A household’s SNAP benefit allotment is a function of the maximum benefit minus a household’s expected contribution toward purchasing food. The Thrifty Food Plan (the TFP) specifies the bundle of foods constituting a nutritious diet that can be purchased at minimal cost; the value of this bundle, which was last updated in 2006, serves as the basis for the value of the maximum SNAP benefit. The maximum benefit is then adjusted by family size. A household without net income receives the maximum benefit. Households with positive income (net of deductions for labor-market earnings, dependent care, housing costs, and other expenses) see their SNAP benefit reduced by 30 cents for every dollar of net income.
There is almost no geographic variation in the SNAP benefit formula. Alaska and Hawaii do have a higher maximum benefit, which the Institute of Medicine report on SNAP benefit adequacy speculated was due to their presumed higher food costs. The benefit formula makes these two states the exception, but evidence from the past two decades suggests that there are substantial local differences in food prices across the rest of the United States.
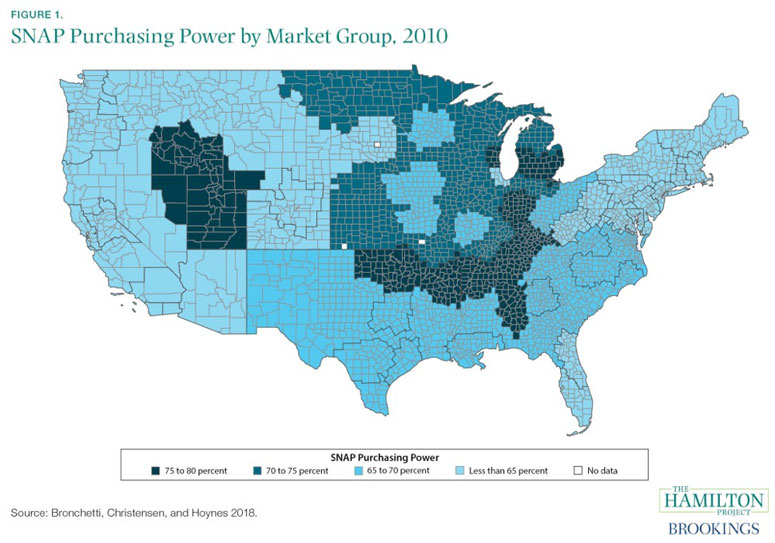
Indeed, the data show that not only do food costs differ by region, but that “trends in food prices by markets are quite different over time. For example, in the Mountain West market centered on Utah, SNAP purchasing power increased from 65 to 70 percent in 1999 to 75 to 80 percent in 2010; while SNAP purchasing power in Maine and upper New Hampshire and Vermont decreased from 65 to 70 percent in 1999 to less than 65 percent in 2010.”
Sign up for our free newsletters
Subscribe to NPQ's newsletters to have our top stories delivered directly to your inbox.
By signing up, you agree to our privacy policy and terms of use, and to receive messages from NPQ and our partners.
Of course, where food prices are higher, the ability of an adjusted SNAP benefit to maintain family nutrition is correspondingly lower, leading to higher rates of child, adult, and household food insecurity. The logic behind a readjustment in benefits seems clear.
The Quarterly Food-at-Home Price Database (QFAHPD) was developed to offer data that would be useful for policymakers. However, it only covers about three dozen locations in the United States. But the data provided show the wide variance in the cost of food from location to location.
The map below clearly shows where SNAP inequity plays out. The lighter blue areas indicate where the “spending power” of SNAP is diminished by the higher costs of food in the geographic areas.
The impact of SNAP inequity goes beyond the ability to purchase nutritious food for a struggling family; there are implications for the health and educational outcomes of the children who experience food insecurity as a result. In a working paper by Erin T. Bronchetti, Garret S. Christensen, and Hilary W. Hoynes focused on food prices, SNAP, and child health, they conclude that lower SNAP purchasing power leads to lower use of preventative health care and, thus, more days of school missed because of illness. This research indicated that a 10 percent increase in SNAP purchasing power increases the likelihood that a child will have an annual health checkup by 8.1 percent. That seems significant in terms of healthcare costs and child well-being.
In Brookings’ article, Hoynes and Ziliak, suggest the government should transition to a geographically-adjusted maximum benefit for SNAP. “Replacing the annual national CPI adjustment with an annual local CPI adjustment would account for level and trend differences in food prices by place, replicate an existing process, and minimize administrative burden.” They indicate that this could be facilitated by the Bureau of Labor Statistics producing and publishing local Consumer Price Indices (CPI) for the 29 food categories in the Thrifty Food Plan (TFY).
SNAP has been one of the most successful programs in achieving its goal of alleviating food insecurity for children and families in poverty. If balancing the geographic inequities of this successful program could improve family nutrition, as well as boosting children’s health and school attendance rates, it seems worthy of attention.—Carole Levine