
Does a diversified revenue base make for a more profitable—and therefore sustainable—nonprofit? Does government funding create big financial problems? Does owning a facility improve an organization’s financial health?
In a recent study, the Nonprofit Finance Fund set out to test these nuggets of conventional wisdom. We analyzed IRS Form 990s from 1,085 youth-serving organizations in five states with annual expenses of greater than $1 million. Unsurprisingly, the findings show that the conventional wisdom often falls short of describing reality and may lead organizations and funders to make strategic errors that undermine organizational effectiveness for decades.
Does a Diverse Revenue Base Improve Financial Health?
In the nonprofit sector, it seems almost axiomatic that diversified revenue improves financial health. But in figure 1 we see that the proposition is more complicated than the question suggests. In fact, based on this sample, it appears that where revenue diversity is concerned, there can be too much of a good thing.
For each of the years between 2000 and 2005, we took the entire sample and compared the number of major revenue sources with levels of organizational profitability. When we talk about a revenue source, we talk in terms of category; government contracts, for instance, would be one source, charitable contributions another, “endowment” income a third. Profitability is defined as the positive change in net assets as a percentage of total expenses. Figure 1 indicates that in each of those six years, organizations with only one major revenue source are less profitable than those with two. For the organizations with one major revenue source, the percentage of profitability is between 2.5 percent and 4.3 percent; with two revenue sources, profitability is between 3.7 percent and 7.2 percent (which is a similar range to what a reasonably profitable for-profit business of similar size might expect). It makes sense that having a second line of business would improve profitability, because many nonprofits lose money on their mission-related business (which may be dominated by earned revenue from government contracts, tuition, ticket sales, and similar sources). These primary sources of revenue, in which the payer (as opposed to a third party) pays for the delivery of services, typically cover less than the full cost of providing the service. Thus, a second source of revenue, usually fundraising, is required just to achieve break-even operations.
It is easy to conclude that two revenue sources are better than one, but interestingly, more isn’t necessarily better. When organizations have a third major revenue source, profitability declines and, in some cases, to levels below that of organizations with only one primary source. This likely happens because a third line of business creates complexity and drives up internal costs, boosting the overall cost structure. Thus, even with the increased revenue, net revenue (or profitability) declines. This is especially true when a third line of business involves new activities. Missiondriven organizations don’t always appreciate the need for the new skills, systems, and capital that comes with starting yet another business line.
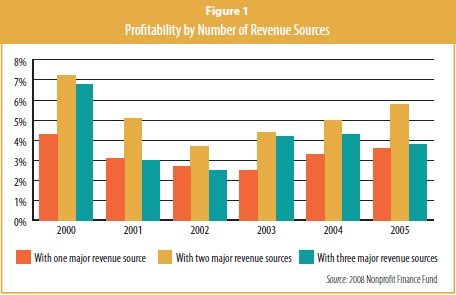
Thus, the analysis indicates that some level of funding diversity is good, but overdoing it may increase costs and complicate operations, which can in turn decrease profitability.
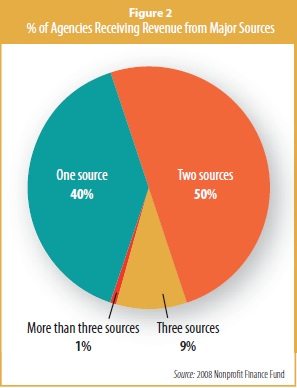
In any event, the question may be moot, because when we looked at the true extent of diversification among nonprofits in the sample, we found that nonprofit managers pretty reliably emulate Adam Smith’s homo economus: they seek the greatest gain for the least effort (see figure 2). Recognizing that two lines of business are plenty of work, few venture into three or more.
Does Govt. Funding Lead to Financial Problems?
The dominant source of revenue is more important in predicting profitability than the number and diversity of sources. Figure 3 shows that organizations dominated by either nongovernmental earned revenue or charitable contributions outstripped by a factor of two the profitability of those relying on government revenue. The median agency funded by earned revenue or private contributions operates at almost a 5 percent margin, while the median agency funded by government produced narrower margins of 2 percent to 3 percent.
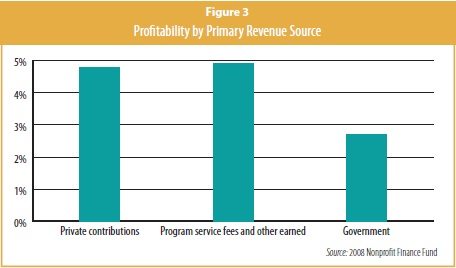
Thus, if your organization’s primary source of revenue is government, you are going to be half as profitable as organizations whose primary source of revenue comes from program service fees or private contributions. And when it comes to cash availability, this disparity becomes even more discouraging for government contractdominated organizations. Figures 4 and 5 provide a fascinating picture of the correlation between government funding and liquidity.
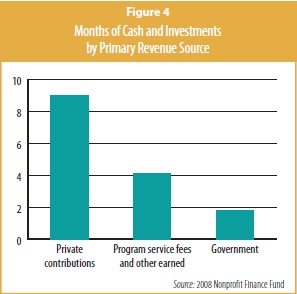
Figure 4 indicates that if your primary revenue source is private contributions, you are likely to have, on average, nine months of cash and investments in the bank. Contrast this with a youth-serving organization that relies primarily on government, which has less than two months’ worth of cash and investments. While hardly rolling in cash, even those relying on service fees have, on average, four months of cash and investments on hand. This shows that source matters.
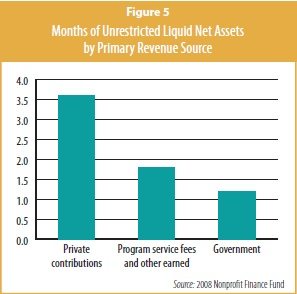
Of course, in nonprofit land not all cash is fungible, because we routinely restrict cash with respect to purpose and timing. To address these restrictions, we peer into organizations’ net assets, particularly at the levels of unrestricted liquid net assets (see figure 5). The median “liquid” net assets—our best measure of potentially deployable cash—are reduced by half for those dependent on contributions (to 3.5 months) or service fees (to 1.7 months) and for those relying on government sources, it declines to just more than four weeks of liquidity. In other words, if all revenue stopped, predominantly government- funded organizations (and remember, these are often the organizations that serve the poorest and frailest among us), could carry on for about a month.
One contributing factor here is that government funders may regulate nonprofit contractors in ways they would not regulate for-profit contractors, including in some cases (and this happens most frequently at the state level) requiring that available cash be spent on current services before reimbursement is released.
Sign up for our free newsletters
Subscribe to NPQ's newsletters to have our top stories delivered directly to your inbox.
By signing up, you agree to our privacy policy and terms of use, and to receive messages from NPQ and our partners.
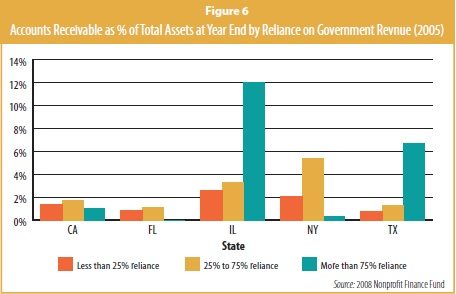
Our clients have two frequent complaints about government funders: (1) they don’t pay enough, and (2) they don’t pay on time. We explored the latter issue by looking at average accounts receivable at fiscal year-end 2005 (see figure 6, on page 15). Results show that in Illinois and Texas, the higher your reliance on government funding, the higher your accounts receivable as a percentage of total assets; but in California, Florida, and New York, we found the opposite.
In fact the more reliant you are, the lower the level of accounts receivable And even at 12 percent for Illinois and at 6 percent for Texas, accounts receivable is not overwhelmingly high. In standard business terms, an accounts-receivable level of 10 percent is generally supportable with cash reserves or a line of credit. That said, if we couple government contractors’ low liquidity with other possible business drivers—such as an overstressed back office, which might not have billed all of its receivables—we fill out the picture.
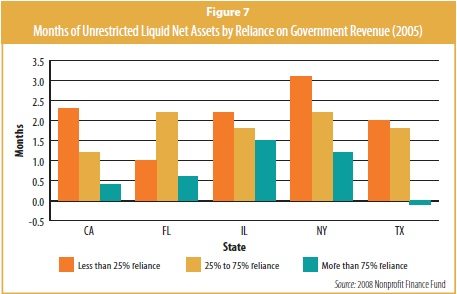
Figure 7 further reflects the effect on liquidity. Once again, the picture is that the more reliant organizations are on government revenue, the less cash they have on hand. In every state, cash reserves are best for organizations less reliant on government and worst for those most reliant. In Texas, in fact, the median organization that relies heavily on government funding experienced negative “liquid” net assets.
Low liquidity engenders organizational stress (often diagnosed as capacity issues), since cash is the lifeblood of a healthy, risk-ready enterprise. Without it, a crisis atmosphere prevails. You can’t make payroll, fund costs and equipment repairs, and make needed replacements. As a result, this situation leads to frequent facilities crises. In turn you put off training staff and neglect maintaining quality. Staff members may believe that they should job-hunt or employees may burn out from spending too much time in crisis mode. If you don’t get rid of that underlying cause, no amount of well-intentioned capacity building will help.
The implications of inadequate capital structure— especially cash availability—are serious. Government-dependent and cash-poor nonprofits simply can’t absorb much risk. As Wall Street risk guru Peter Bernstein says, “Risk means not having cash when you need it.” Harvard University and Wal-Mart may not be managerially perfect, but they have enough cash to cover bumps in the road. And in the current environment, we need only look at Wall Street institutions to know that cash availability makes the difference for all businesses regardless of size or sector.
So is government funding a problem? Our results indicate that high dependence on government funding produces low levels of profitability and liquidity, foreshadowing myriad capacity and morale problems and little ability to absorb risk. We should be particularly concerned because organizations that suffer from these challenges are exactly those that serve groups also unable to absorb risk: the poor, the disabled, orphans, and the elderly. Not only are their lives hanging in the balance, their safety net is tattered, financially unready to absorb predictable and reasonable levels of risk on their behalf.
Does Facility Ownership Promote Stability?
Nonprofits often have a host of reasons to justify a property purchase: “If we build it, they will come.”; “The city will sell it to us for a dollar.”; “It will be cheaper than renting, and we will build equity.”; and “We can rent out the extra space.”
But here’s a secret: when you increase your fixed costs, you have to increase your reliable revenue. This fact is strangely elusive to many in our sector—and often with regrettable results. Numerous mission- and program-related motivations prompt nonprofits to own property, but the improved financial health that results from ownership is often elusive (see “Owning Real Estate: A Deeper Look” on page 16).
One thing’s for sure: building ownership is pervasive among youth-serving organizations. In this study, we found that almost 90 percent of responding organizations appeared to own real estate. This pattern runs counter to that of for-profit business, where 90 percent of the square footage occupied by U.S. corporations is leased. Among for-profits, a building is simply a means to an end, not a naming opportunity or a chance to get into the real estate business (unless real estate management is a core business). These companies want the most appropriate, well-located space at the lowest cost, preferably turnkey. And if their market or business changes, they want flexibility. But nonprofits have a different perspective.
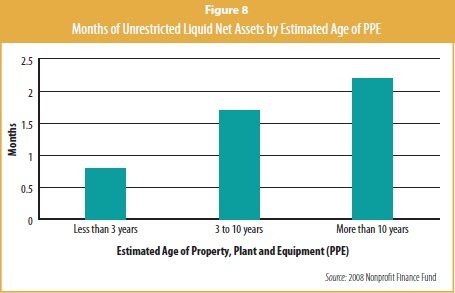
Referring to the points we’ve made previously about the critical importance for nonprofits having cash on hand, we consider the effect of building ownership on liquidity. Figure 8 shows that the organizations in this study that bought buildings depressed their liquidity for years afterward. The column on the left demonstrates that organizations that have owned their real estate for less than three years have less than a month of unrestricted liquid net assets and, even 10 years later, the median organization has just barely more than two months of cash. This is a portrait of organizations that are “house poor”: asset rich but liquidity starved. “Water, water every where, nor any drop to drink,” as Samuel Taylor Coleridge writes in the “Rime of the Ancient Mariner.”
A difficult irony is that many nonprofits think of owning a building in the same way many of us think about owning a house. It is a rite of passage, something deeply emotional. Americans believe that homeownership can help us build standing and wealth—and in the case of a residence, that’s often true. We have a variety of government programs and tax advantages that make it so. In many cases it’s also about turf, and springs from a thirst for freedom and control that land ownership implies. We imagine that we want ownership of our communities, and have access to the wealth—and revenue—we help create. And that is where reality can depart from conventional wisdom.
Now, that does not mean that from a programmatic point of view property ownership is always bad or unwise. But from a purely business point of view—one that is green-eyeshade-friendly—there is a greater likelihood that owning and operating real estate will leech an organization’s time, money, and attention from programs and, by increasing fixed costs and decreasing liquidity, will limit its programmatic and financial flexibility and ability to absorb risk.
Conclusion
While pattern recognition is helpful in predicting and planning your organization’s financial future, both funders and nonprofits may use time-honored assumptions and rules of thumb that are well meaning but misleading. A fresh look at some 990 data is helpful in guiding us toward a more nuanced view. And while this article explored only youth-serving organizations, we believe that the findings can be generalized for a variety of nonprofits, including arts organizations, charter schools, social-service agencies, and others.